# Welcome to PowerTable

Build no-code Data Apps with approvals, workflows, audit & governance

Welcome to PowerTable!!!

PowerTable allows business users to build **no-code, writeback-enabled** **table apps** on Microsoft Fabric.

In the following sections, we’ll take a look at the following:

1. [**PowerTable: A Quick Overview**](#id-1.-powertable-a-quick-overview)
2. [**PowerTable’s High-Level Architecture**](#id-2.-powertables-high-level-architecture)
3. [**What makes PowerTable unique? - A Summary**](#id-3.-what-makes-powertable-unique-a-summary)
4. [**Additional Resources**](#id-4.-additional-resources)

## **1. PowerTable: A Quick Overview**

PowerTable allows you to do the following:

### 1. Build Data Apps that connect LIVE to your modern OLTP or OLAP data platforms

PowerTable helps you to build tabular data apps that connect LIVE to your data platform. The product is engineered to support both write-optimized **OLTP** (Online Transaction Processing) platforms and read-optimized **OLAP** (Online Analytical Processing) platforms. The following platforms are supported:

![Supported data platforms](https://1781349671-files.gitbook.io/~/files/v0/b/gitbook-x-prod.appspot.com/o/spaces%2FKyXRCFh0c08ryiUFvyMV%2Fuploads%2F9j6JygnKPeFJyML7E67Y%2Fimage.png?alt=media\&token=c888424d-ae21-44b3-b42b-aaad59e2cbbc)

One of the benefits of using PowerTable is that it maintains LIVE synchronization between the apps and underlying tables.

Note that the source and destination tables for the App are the same in this case.

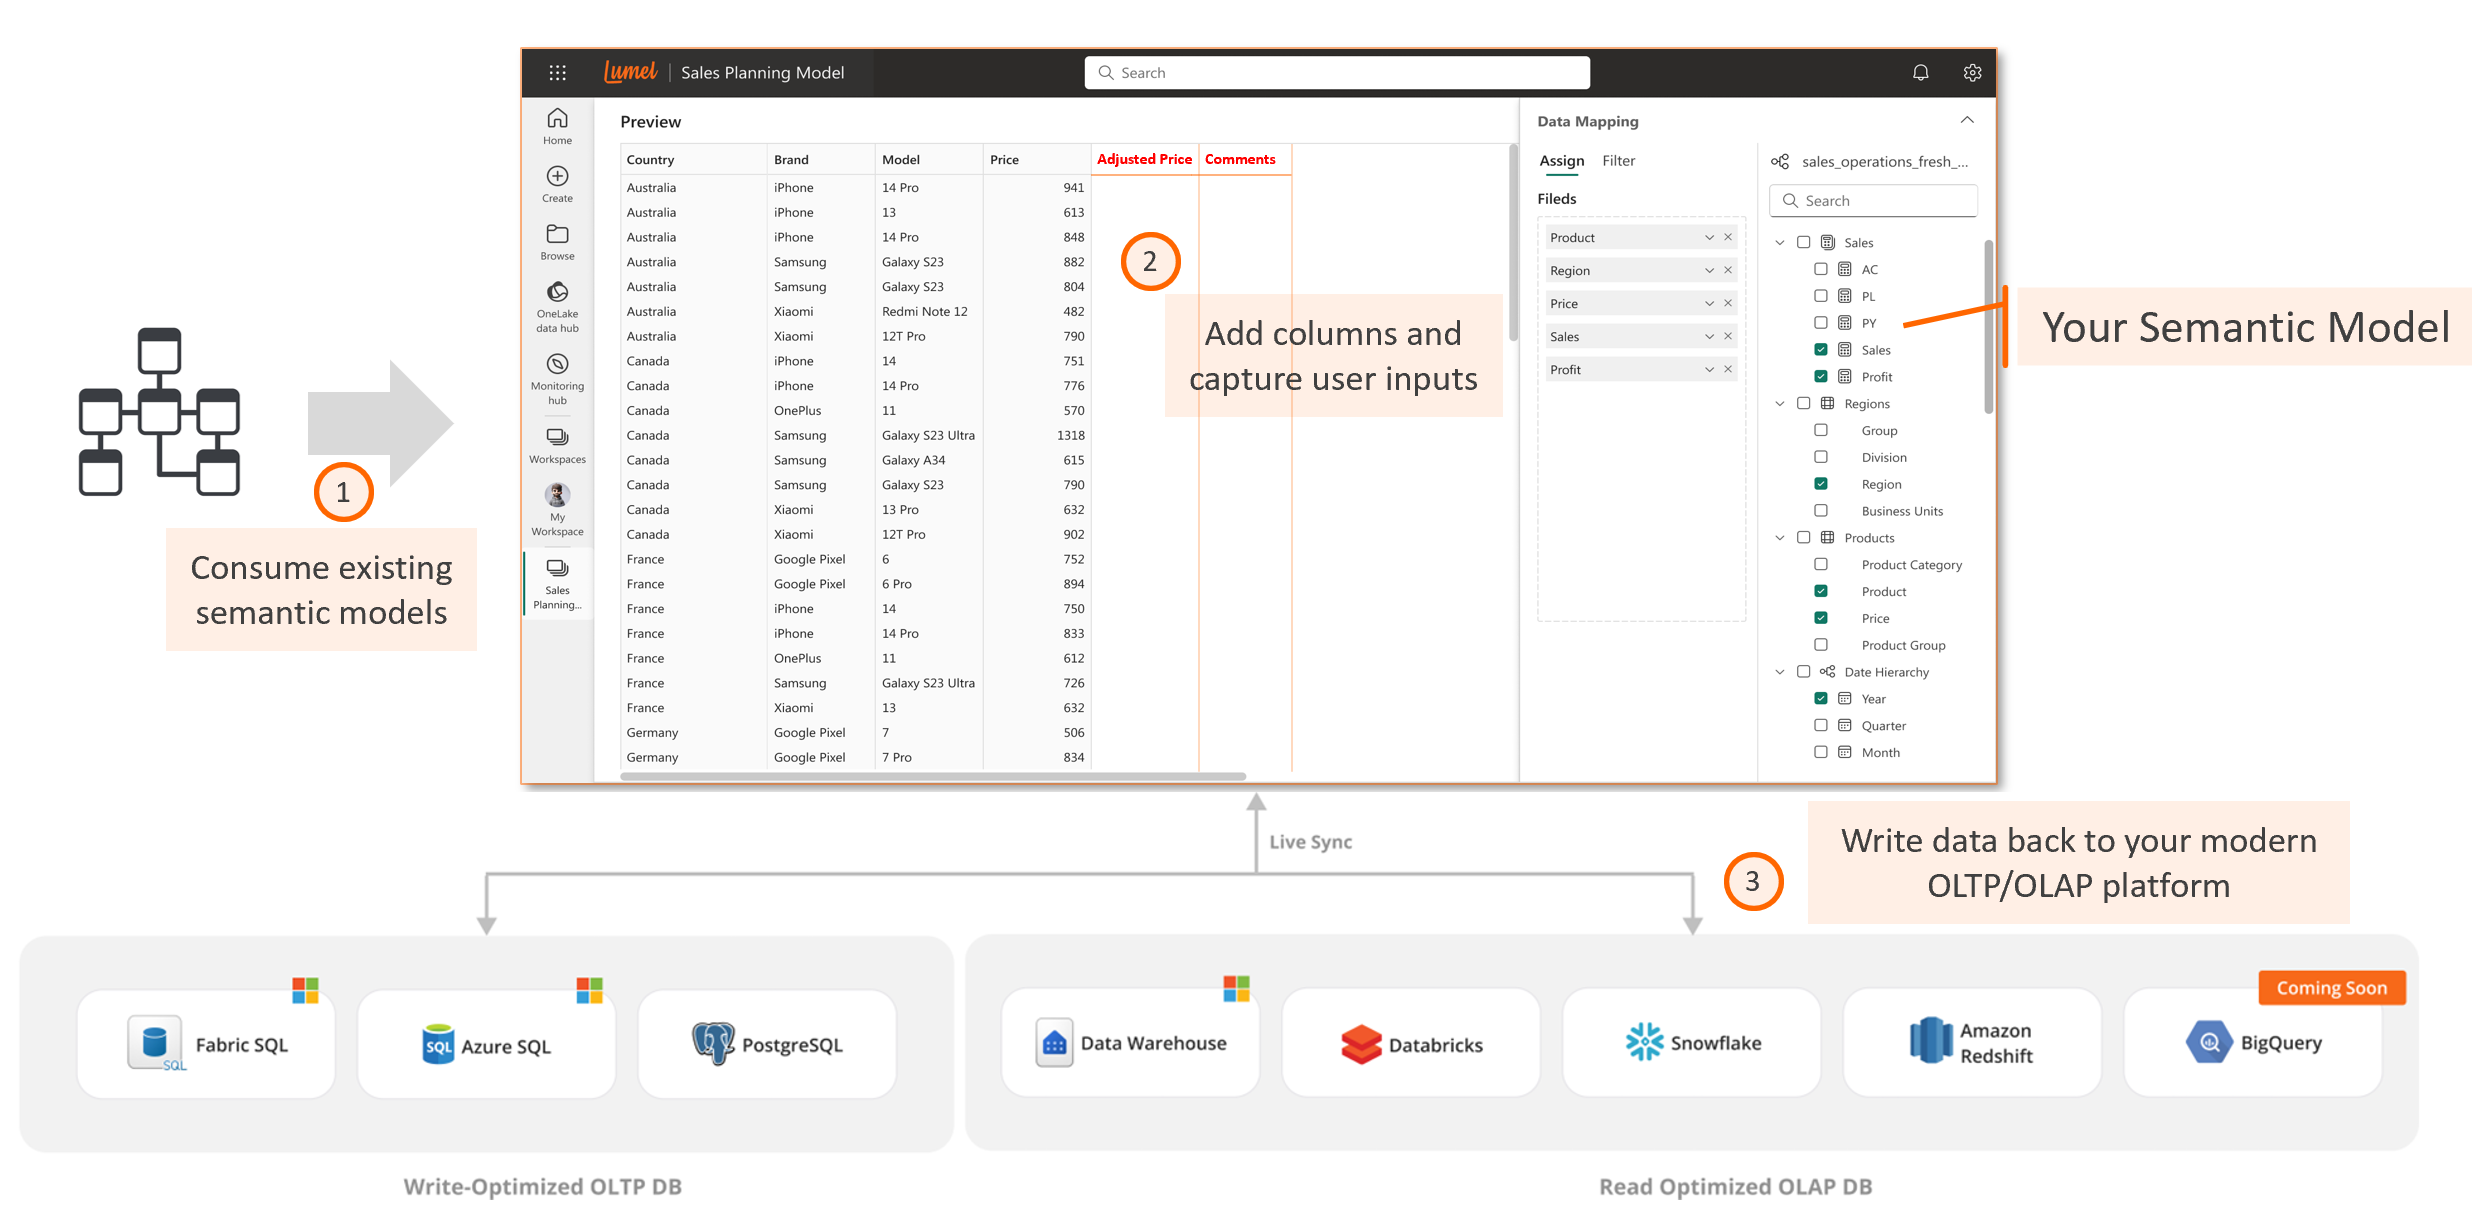
### **2. Consume semantic models and build writeback-enabled apps**

PowerTable also allows you to build Data Apps on top of your existing semantic models. These apps can capture user inputs and write back data to your data platform.

Unlike the [previous scenario](#id-1.-build-data-apps-that-connect-live-to-your-modern-oltp-or-olap-data-platform), the source and destination data stores are different when you consume semantic models.

<figure><img src="https://1781349671-files.gitbook.io/~/files/v0/b/gitbook-x-prod.appspot.com/o/spaces%2FKyXRCFh0c08ryiUFvyMV%2Fuploads%2F8HjhPT9gug4kQINC0fXy%2F1.png?alt=media" alt=""><figcaption></figcaption></figure>

### **3. Leverage built-in no-code workflow, automation and governance capabilities**

PowerTable comes with built-in access control, workflow, approval, automation, audit, and governance capabilities. These no-code, out-of-the-box capabilities are a great value add for:

1. Migrating your spreadsheet apps such as lists (e.g., Products) or trackers (e.g., Project status).
2. Managing your reference data supporting your reporting and planning applications.

![](https://1781349671-files.gitbook.io/~/files/v0/b/gitbook-x-prod.appspot.com/o/spaces%2FKyXRCFh0c08ryiUFvyMV%2Fuploads%2FkSB126b4TRgkOT149wCu%2F2.png?alt=media)

Note that the master data maintained in your ERP or CRM systems have rigid rules to capture forward-looking data (e.g., a product that is yet to be launched, a company that will soon become a customer, a position for which a candidate has not been hired yet, etc.). PowerTable empowers business users to manage these scenarios with ease without relying on IT.

### **4. Leverage push-down SQL for enhanced scalability**

Unlike other products in the market that typically struggle to handle more than tens or hundreds of thousands of rows, PowerTable is highly scalable and can support millions of rows. This is possible as our architecture segregates the user interface from storage and compute and uses pushdown SQL to perform all processing on the underlying database.

![](https://1781349671-files.gitbook.io/~/files/v0/b/gitbook-x-prod.appspot.com/o/spaces%2FKyXRCFh0c08ryiUFvyMV%2Fuploads%2FFSuuNfLQUUNOZtAhxdCf%2F3.png?alt=media)

## **2. PowerTable's High-level Architecture**

PowerTable leverages a unique, industry-leading architecture that helps enterprises increase their Return on Investment (ROI) on their modern data platform.&#x20;

Enterprises have already invested in modern data platforms such as Microsoft Fabric, Databricks, and Snowflake. However, all applications in the market today (such as the Enterprise Planning software) require you to replicate or transfer your data to their designated data store. Any updates you make to the data through these apps are retained in the same store, resulting in a data silo.

This approach increases cost & complexity for enterprises as they need to perform ETL and complex integrations. Most often, they also need to move the data from such dedicated data stores back to their data platform.&#x20;

PowerTable, on the other hand, syncs LIVE with your modern data store, avoiding replication of data.&#x20;

In addition, it utilizes push-down SQL to run all processes on the data platform, enhancing scalability and performance. The modern architecture is summarized below.

![](https://1781349671-files.gitbook.io/~/files/v0/b/gitbook-x-prod.appspot.com/o/spaces%2FKyXRCFh0c08ryiUFvyMV%2Fuploads%2FUJvXTC0fMQGPiAImfp4d%2F4.png?alt=media)

## **3. What makes PowerTable unique? - A Summary**

Compared to other products in the market, PowerTable is unique as it allows you to do the following:

* Build modern data apps that sync LIVE to your modern OLTP/OLAP data store
* Consume semantic models and build writeback-enabled apps
* Leverage no-code workflow, automation and governance capabilities
* Utilize push-down SQL for enhanced scalability
* Leverage your existing security and authentication provider

...and more.

## **4. Additional Resources**

For any questions or feedback, visit our community portal here: [https://community.powertable.com.](https://community.powertable.com/)


# Get Started

Let us get started with PowerTable. This section covers the prerequisites for creating a PowerTable item, its supported data platforms, and the admin setup guide for adding the necessary workload to your Fabric workspace for a free trial.

> [Prerequisites](/explore-powertable/get-started/prerequisites)

> [Supported Data Platforms](/explore-powertable/get-started/supported-data-platforms)

> [Admin Setup Guide (15-day Free Trial)](/explore-powertable/get-started/admin-setup-guide-15-day-free-trial)


# Prerequisites

Before you set up PowerTable, you must ensure you meet the prerequisites outlined below. Reach out to your Fabric administrator for further assistance.

## **Prerequisites:**

* **Microsoft Office 365 credentials:** PowerTable is a native Microsoft Fabric workload, so you require your Microsoft O365 credentials to log in.&#x20;
* **Tenant Access:** Ensure you’re connected to your organization's tenant.
* **Paid or trial Fabric capacity:** Ensure your workspace has a paid or trial Fabric capacity.

<figure><img src="https://1781349671-files.gitbook.io/~/files/v0/b/gitbook-x-prod.appspot.com/o/spaces%2FKyXRCFh0c08ryiUFvyMV%2Fuploads%2Fc2C2DuoXUn2Xg6TapVAo%2Fimage.png?alt=media&amp;token=684d4109-5f09-4ba2-9c6f-9204c5875314" alt=""><figcaption></figcaption></figure>

* **Workload Settings:** Capacity admins and users with relevant permissions can add Fabric workloads and make them available either to the entire tenant or to a specific capacity. Make sure a Fabric admin grants the necessary permissions to users who wish to add and use workloads.
* **Access to Workspace:** Ensure that you have the necessary access permissions (Admin or Member access) to relevant workspaces so you can create PowerTable apps and workspace items.

<figure><img src="https://1781349671-files.gitbook.io/~/files/v0/b/gitbook-x-prod.appspot.com/o/spaces%2FKyXRCFh0c08ryiUFvyMV%2Fuploads%2FtCec03K90oRXmrkge7BE%2Fimage.png?alt=media&amp;token=8d41ceb5-6e73-419a-9020-5adde7f5951b" alt=""><figcaption><p>Workspace on a Fabric capacity</p></figcaption></figure>

* Ensure that the following resource providers are registered in your Azure subscription:
  * **Microsoft.Storage**
  * **Microsoft.Sql**
* **Access to databases/warehouses:** Ensure you have access to the necessary data platform, database, lakehouse, or warehouse.
* **Whitelist IP addresses in Azure SQL firewall rules:** Network firewalls block connections from IP addresses that do not have permissions. You need to whitelist PowerTable's outbound IPs in your Azure SQL database firewall rules.

If you encounter any challenges in setting up the PowerTable workload, do not hesitate to reach out to us at our [PowerTable Community](https://community.powertable.com/home).&#x20;

#### References

1. Workspace license information: <https://learn.microsoft.com/en-us/fabric/enterprise/licenses#workspace>
2. Workspace roles: <https://learn.microsoft.com/en-us/fabric/fundamentals/roles-workspaces>
3. Who can add Fabric Workloads - <https://learn.microsoft.com/en-us/fabric/workload-development-kit/more-workloads-add#add-and-remove-workloads>


# Supported Data Platforms

PowerTable currently supports the following OLTP and OLAP data platforms.

* **Online Transaction Processing (OLTP) platforms**&#x20;
  * Azure SQL
  * Fabric SQL
  * PostgreSQL
* **Online Analytical Processing (OLAP) platforms**

  * Databricks
  * Snowflake
  * Amazon Redshift
  * BigQuery

<figure><img src="https://1781349671-files.gitbook.io/~/files/v0/b/gitbook-x-prod.appspot.com/o/spaces%2FKyXRCFh0c08ryiUFvyMV%2Fuploads%2F9j6JygnKPeFJyML7E67Y%2Fimage.png?alt=media&amp;token=c888424d-ae21-44b3-b42b-aaad59e2cbbc" alt=""><figcaption><p>Supported Data Platforms</p></figcaption></figure>


# Admin Setup Guide (15-day Free Trial)

Lumel PowerTable is available as part of the **Lumel EPM Workload**, and you need to ensure that it is provisioned in your workspace before starting to work with it. Let us walk through the steps for a quick setup.

{% hint style="info" %}
Please refer to the [prerequisites ](/explore-powertable/get-started/prerequisites)before provisioning the workload for a seamless experience.
{% endhint %}

## 1. Provision the Lumel EPM workload

1. Log on to Microsoft Fabric. Click on **Workloads** in the left navigation panel.&#x20;

<figure><img src="https://1781349671-files.gitbook.io/~/files/v0/b/gitbook-x-prod.appspot.com/o/spaces%2FKyXRCFh0c08ryiUFvyMV%2Fuploads%2F5AGdUHp2Uat05y2d9naF%2Fimage.png?alt=media&amp;token=76a6a6dd-f057-4527-b4ab-650ea780347e" alt=""><figcaption><p>Click 'Workloads'</p></figcaption></figure>

If you do not see the 'Workloads' option, click the '**…'** button to view more options and select it from there.

<figure><img src="https://1781349671-files.gitbook.io/~/files/v0/b/gitbook-x-prod.appspot.com/o/spaces%2FKyXRCFh0c08ryiUFvyMV%2Fuploads%2FJ0oDmNVkY9CU2fEi3NT2%2Fimage.png?alt=media&amp;token=f3353d45-9806-4926-b797-ef5a7533ba33" alt=""><figcaption></figcaption></figure>

2. Choose **Lumel EPM** workload.

<figure><img src="https://1781349671-files.gitbook.io/~/files/v0/b/gitbook-x-prod.appspot.com/o/spaces%2FKyXRCFh0c08ryiUFvyMV%2Fuploads%2FvagTplisAnCtPjusJTMQ%2Fimage.png?alt=media&amp;token=6c0cc347-ed11-4f94-969c-7c9325f48361" alt=""><figcaption><p>Choose Lumel EPM workload</p></figcaption></figure>

3. Click **Add Workload.**

<figure><img src="https://1781349671-files.gitbook.io/~/files/v0/b/gitbook-x-prod.appspot.com/o/spaces%2FKyXRCFh0c08ryiUFvyMV%2Fuploads%2Fd1pS2gBg6I5zV8i79r38%2Fimage.png?alt=media&amp;token=8dcde817-de3d-4cab-b428-5a7dc9b1c0ca" alt=""><figcaption><p>Add Workload</p></figcaption></figure>

4. Choose the capacities you want to add this workload to. Select the capacity assigned to your workspace. Then click **Add Workload.**

<figure><img src="https://1781349671-files.gitbook.io/~/files/v0/b/gitbook-x-prod.appspot.com/o/spaces%2FKyXRCFh0c08ryiUFvyMV%2Fuploads%2FhmZL9hRGQm2ikXC3CWvO%2Fimage.png?alt=media&amp;token=eecb9848-f2f5-4a03-8eec-d9a5373d9927" alt=""><figcaption><p>Choose the capacity to add workload</p></figcaption></figure>

5. Click **Continue** to view the permissions. Then, click **Accept** to grant the requested permissions.

<figure><img src="https://1781349671-files.gitbook.io/~/files/v0/b/gitbook-x-prod.appspot.com/o/spaces%2FKyXRCFh0c08ryiUFvyMV%2Fuploads%2F6QEX9fV0h8KiagEKNqjw%2Fimage.png?alt=media&amp;token=04337bbf-0421-442a-a9a6-a7f9749db83e" alt=""><figcaption><p>Accept requested permissions</p></figcaption></figure>

Your 15-day free trial is now activated.

<figure><img src="https://1781349671-files.gitbook.io/~/files/v0/b/gitbook-x-prod.appspot.com/o/spaces%2FKyXRCFh0c08ryiUFvyMV%2Fuploads%2FoTeo4TFDL97scaKCGnzg%2Fimage.png?alt=media&amp;token=f9b5fa53-9f59-4444-8c07-705663f8156c" alt=""><figcaption><p>Trial activated</p></figcaption></figure>

You can now create a workspace on Fabric capacity.

## 2. Create Workspace on Fabric capacity (if not created already)

Please follow the steps illustrated in the image below to create a workspace on Fabric capacity.

<figure><img src="https://1781349671-files.gitbook.io/~/files/v0/b/gitbook-x-prod.appspot.com/o/spaces%2FKyXRCFh0c08ryiUFvyMV%2Fuploads%2FryTXJD9D1oO8yHV2ykym%2Fimage.png?alt=media&amp;token=94f118a3-f91a-49e5-a24f-b588b7ddd77a" alt=""><figcaption><p>Create workspace on Fabric capacity</p></figcaption></figure>


# PowerTable - Product tour

This section will take you through a product tour. To begin, you can explore the sections below:

> [Explore a sample app](/explore-powertable/powertable-product-tour/explore-a-sample-app)

> [Build your first app](/explore-powertable/powertable-product-tour/build-your-first-app)

> [Layout & User Interface](/explore-powertable/powertable-product-tour/layout-and-user-interface)


# Explore a sample app

This section walks you through a sample PowerTable app so you can **explore PowerTable without having to connect to your database.**&#x20;

1. Log on to Microsoft Fabric. Click on **New item** to create a new PowerTable item in your workspace.

<figure><img src="https://1781349671-files.gitbook.io/~/files/v0/b/gitbook-x-prod.appspot.com/o/spaces%2FKyXRCFh0c08ryiUFvyMV%2Fuploads%2FAGG3A88bOirSn9jsXpnS%2F2025-07-25_16h14_38.png?alt=media&amp;token=e966bb36-1000-415d-a268-e2d026b8068f" alt=""><figcaption><p>Create a new item</p></figcaption></figure>

2. Select **Lumel PowerTable** from the list of items.

<figure><img src="https://1781349671-files.gitbook.io/~/files/v0/b/gitbook-x-prod.appspot.com/o/spaces%2FKyXRCFh0c08ryiUFvyMV%2Fuploads%2FrcYrLBFROaePfEA5bkgC%2F2025-07-25_17h25_55.png?alt=media&amp;token=810c80d6-0030-4092-b641-4c8cc3c61f3c" alt=""><figcaption><p>Select 'PowerTable'</p></figcaption></figure>

3. Enter a name for your PowerTable item and select the workspace. Click **Create.** A PowerTable item gets created.

<figure><img src="https://1781349671-files.gitbook.io/~/files/v0/b/gitbook-x-prod.appspot.com/o/spaces%2FKyXRCFh0c08ryiUFvyMV%2Fuploads%2Fr5Pu2iu8b4gIukAlDwNm%2F2025-07-25_17h27_30.png?alt=media&amp;token=e48420aa-2204-4958-b813-cb0f6116724c" alt=""><figcaption><p>Create PowerTable item</p></figcaption></figure>

4. Click on **Explore PowerTable.**&#x20;

<figure><img src="https://1781349671-files.gitbook.io/~/files/v0/b/gitbook-x-prod.appspot.com/o/spaces%2FKyXRCFh0c08ryiUFvyMV%2Fuploads%2FhVPMBjHzsoD8ptnUvBPk%2F2025-07-25_17h30_01.png?alt=media&amp;token=53d082f6-b75f-4cee-8ace-a52c06b6287d" alt=""><figcaption><p>Explore PowerTable</p></figcaption></figure>

{% hint style="info" %}
You may also select 'Create a New App' to build your first PowerTable app. Please refer to [this section](/explore-powertable/powertable-product-tour/build-your-first-app) to know more.
{% endhint %}

5. You can explore PowerTable with any of our sample templates. Select any one and click **Create.**

Let's start with a simple template that includes two tables: **Employee Management.**&#x20;

<figure><img src="https://1781349671-files.gitbook.io/~/files/v0/b/gitbook-x-prod.appspot.com/o/spaces%2FKyXRCFh0c08ryiUFvyMV%2Fuploads%2F5iRmpKorq3ov7qmDukFY%2F2025-07-25_17h31_33.png?alt=media&amp;token=01fb3a0d-620c-4086-a609-461879f27f64" alt=""><figcaption><p>Choose a template</p></figcaption></figure>

6. Two tables—'Department' and 'Employee'—are loaded into PowerTable for you to explore its features.

<figure><img src="https://1781349671-files.gitbook.io/~/files/v0/b/gitbook-x-prod.appspot.com/o/spaces%2FKyXRCFh0c08ryiUFvyMV%2Fuploads%2FACUASbRXZxDEHljtKvR0%2Fimage.png?alt=media&amp;token=58a22ddb-1428-4d6b-9ac2-9a1629aa70d3" alt=""><figcaption><p>Sample Powertable template</p></figcaption></figure>

7. The **Home** tab includes options for importing and inserting rows, grouping records, sorting, searching, and filtering records, as well as layout settings, audit trails, export options, and more.

<figure><img src="https://1781349671-files.gitbook.io/~/files/v0/b/gitbook-x-prod.appspot.com/o/spaces%2FKyXRCFh0c08ryiUFvyMV%2Fuploads%2Fjhg5m8bKg4Hl3PwI4gDH%2Fimage.png?alt=media&amp;token=2386fc38-06dd-452f-befe-b1d9f135f6d6" alt=""><figcaption><p>The Home tab</p></figcaption></figure>

8. The **Format** tab lets you customize appearance, formatting, and display-related settings.

<figure><img src="https://1781349671-files.gitbook.io/~/files/v0/b/gitbook-x-prod.appspot.com/o/spaces%2FKyXRCFh0c08ryiUFvyMV%2Fuploads%2Fwkd8fmR8LvDJCAtPCWN4%2Fimage.png?alt=media&amp;token=dd126b91-35dd-4324-bb2e-b8233aba2369" alt=""><figcaption><p>The Format tab</p></figcaption></figure>

9. The **Setup** tab quickly allows you to configure the column properties and manage row and column access control, automation workflows, forms, layout and table settings.

<figure><img src="https://1781349671-files.gitbook.io/~/files/v0/b/gitbook-x-prod.appspot.com/o/spaces%2FKyXRCFh0c08ryiUFvyMV%2Fuploads%2FPFyMqS4wQ7BXHBuxHGkE%2Fimage.png?alt=media&amp;token=f85d099b-8bb4-420e-8ee2-06af839a8271" alt=""><figcaption><p>Set up columns, access control, automation and forms</p></figcaption></figure>

10. The column configuration settings, collaborative commenting, and approval workflow configuration are all available here, as highlighted below.

<figure><img src="https://1781349671-files.gitbook.io/~/files/v0/b/gitbook-x-prod.appspot.com/o/spaces%2FKyXRCFh0c08ryiUFvyMV%2Fuploads%2F51QrFRg84tBno5AfruDl%2Fimage.png?alt=media&amp;token=dc2a0f24-c509-4538-8459-6c9570b9f8a1" alt=""><figcaption></figcaption></figure>

This documentation provides detailed information on all of the above functionalities and how to use them.

In the next section, we'll look at the steps to build your first PowerTable app.


# Build your first app

PowerTable is a native workload on Microsoft Fabric. This section will help you create your first app in a few simple steps.

**There are several ways to create an app with PowerTable:**

<table data-header-hidden><thead><tr><th width="40" data-type="number"></th><th width="249.90911865234375">Option</th><th width="456.27276611328125">Description</th></tr></thead><tbody><tr><td>1</td><td><a href="#create-a-new-powertable-item"><strong>Import Spreadsheet</strong></a></td><td>Import data from a spreadsheet and start building your app.</td></tr><tr><td>2</td><td><a href="/explore-powertable/create-table-app/connect-to-database"><strong>Connect to Database</strong></a></td><td>Connect to an existing database table and build an app.</td></tr><tr><td>3</td><td><a href="/explore-powertable/create-table-app/enter-data-manually"><strong>Type Data Directly</strong></a></td><td>Enter data directly into the app to create a new table in the database.</td></tr><tr><td>4</td><td><a href="/explore-powertable/create-table-app/connect-to-semantic-model"><strong>Connect to Semantic Model</strong></a></td><td>Connect to a semantic model to build a writeback-enabled app.</td></tr></tbody></table>

{% hint style="info" %}
Note that in the above methods #1 to #3, the source and destination for the app will be the same - i.e., underlying database table.

When you connect to a semantic model (method #4), the semantic model would be the source, and the destination will be the database table. You can use this method to build writeback-enabled applications. You also have the option of scheduling a refresh from the semantic model.
{% endhint %}

For now, we will explore method #1, where we import data from a CSV file and build an app.&#x20;

## Create a New PowerTable item

1. Go to your Microsoft Fabric workspace folder. Click on **New item** to create a new item.&#x20;

<figure><img src="https://docs.powertable.com/~gitbook/image?url=https%3A%2F%2F1781349671-files.gitbook.io%2F%7E%2Ffiles%2Fv0%2Fb%2Fgitbook-x-prod.appspot.com%2Fo%2Fspaces%252FKyXRCFh0c08ryiUFvyMV%252Fuploads%252Fv6FMthDzshgAGStvaqgR%252Fimage.png%3Falt%3Dmedia%26token%3D44e0a878-8140-4d8b-9158-ff44d7be8aac&#x26;width=768&#x26;dpr=4&#x26;quality=100&#x26;sign=89c970e&#x26;sv=2" alt=""><figcaption><p>Create a new item</p></figcaption></figure>

2. Select **PowerTable** from the list of items. You may want to add it to your favorites by clicking on the star icon.

<figure><img src="https://docs.powertable.com/~gitbook/image?url=https%3A%2F%2F1781349671-files.gitbook.io%2F%7E%2Ffiles%2Fv0%2Fb%2Fgitbook-x-prod.appspot.com%2Fo%2Fspaces%252FKyXRCFh0c08ryiUFvyMV%252Fuploads%252FH8BMSvgpmEDArN4MAEyf%252Fimage.png%3Falt%3Dmedia%26token%3Dde2c03f7-bcd2-4350-b1b5-bd742c9ea7fa&#x26;width=768&#x26;dpr=4&#x26;quality=100&#x26;sign=4e543257&#x26;sv=2" alt=""><figcaption><p>Select 'PowerTable'</p></figcaption></figure>

3. Enter a name for your PowerTable app and select the workspace. Click on **Create.**

<figure><img src="https://docs.powertable.com/~gitbook/image?url=https%3A%2F%2F1781349671-files.gitbook.io%2F%7E%2Ffiles%2Fv0%2Fb%2Fgitbook-x-prod.appspot.com%2Fo%2Fspaces%252FKyXRCFh0c08ryiUFvyMV%252Fuploads%252FbfD4QY3B1tkCtgBttzbB%252Fimage.png%3Falt%3Dmedia%26token%3Dbad8d3b3-3803-4b04-bac3-75506e481560&#x26;width=768&#x26;dpr=4&#x26;quality=100&#x26;sign=952e6a98&#x26;sv=2" alt=""><figcaption><p>Create PowerTable item</p></figcaption></figure>

## Create a New App

4. Click on **Create a New App** to create your app. You may also select 'Explore PowerTable' to [experience a sample PowerTable app](/explore-powertable/powertable-product-tour/explore-a-sample-app).

<figure><img src="https://1781349671-files.gitbook.io/~/files/v0/b/gitbook-x-prod.appspot.com/o/spaces%2FKyXRCFh0c08ryiUFvyMV%2Fuploads%2F9Y2g4aFTa2seNAgwphJ1%2Fimage.png?alt=media&amp;token=247930fc-9bd0-4304-b301-979ae9364b9f" alt=""><figcaption><p>Create a New App</p></figcaption></figure>

## Create a Database Connection

When creating a new table or connecting to an existing table in a database, you need to select your preferred data store and establish a database connection. Your app synchronizes its data with this data store.

5. Follow the steps below to create a new connection:

* Click on **New Connection.**
* Choose your preferred data platform. We'll connect to the Fabric SQL database.
* Click **Next.**

<figure><img src="https://1781349671-files.gitbook.io/~/files/v0/b/gitbook-x-prod.appspot.com/o/spaces%2FKyXRCFh0c08ryiUFvyMV%2Fuploads%2Fq9L49oZ76GOQw72zIK8F%2Fimage.png?alt=media&amp;token=b86fc581-8f12-48af-b45f-bace3ac08970" alt=""><figcaption><p>Creating a new connection</p></figcaption></figure>

{% hint style="info" %}
If you already have a shared database connection or a private connection to the required data store, skip step 5. Instead, click on the 'Existing Connection' tab, select the one you want to use, and then click Next.
{% endhint %}

<figure><img src="https://1781349671-files.gitbook.io/~/files/v0/b/gitbook-x-prod.appspot.com/o/spaces%2FKyXRCFh0c08ryiUFvyMV%2Fuploads%2FJXyGxnjfMUSI9vJgtUgp%2Fimage.png?alt=media&amp;token=60ded946-6f5e-4213-bfbe-8e90b5d329b9" alt=""><figcaption><p>Choosing an existing connection</p></figcaption></figure>

6. **Setup Connection:** Enter the connection type and a unique connection name. Select the workspace and the database from the list of options and click **Next.** Your new private connection is now created.

<figure><img src="https://1781349671-files.gitbook.io/~/files/v0/b/gitbook-x-prod.appspot.com/o/spaces%2FKyXRCFh0c08ryiUFvyMV%2Fuploads%2FTglZ6oucQfyVvW16CY7k%2Fimage.png?alt=media&amp;token=f938e785-a7e1-4426-83c7-a4450c913352" alt=""><figcaption><p>Setup Connection</p></figcaption></figure>

## Create a New Table

7. **Choose your table where the data will be stored:** Here, you have two options:

* Select **Existing Table** to connect to an existing table in the database (or)
* Select **New Table** to create a new table in the database.

For our demonstration, we'll select **New Table** to create a new table and import our CSV dat&#x61;**.** We'll also choose a database schema (in this case— 'dbo').

<figure><img src="https://1781349671-files.gitbook.io/~/files/v0/b/gitbook-x-prod.appspot.com/o/spaces%2FKyXRCFh0c08ryiUFvyMV%2Fuploads%2F2JfxNmESDv7VGmse2yvR%2Fimage.png?alt=media&amp;token=f8864b78-3c05-41ff-ac5e-e132fc711191" alt=""><figcaption><p>Create new table</p></figcaption></figure>

8. Enter a name for the table and choose **Upload Excel/CSV.**&#x20;

{% hint style="info" %}
Note that you can also choose to connect to an existing semantic model or enter data manually within the app. These are covered in the following sections.
{% endhint %}

<figure><img src="https://1781349671-files.gitbook.io/~/files/v0/b/gitbook-x-prod.appspot.com/o/spaces%2FKyXRCFh0c08ryiUFvyMV%2Fuploads%2FBlfrnfRgrMnz6ZHYNmqJ%2Fimage.png?alt=media&amp;token=08c952c6-4f4e-4d4d-ab30-950943418bb0" alt=""><figcaption><p>Upload CSV</p></figcaption></figure>

9. Select the file you want to upload.

<figure><img src="https://1781349671-files.gitbook.io/~/files/v0/b/gitbook-x-prod.appspot.com/o/spaces%2FKyXRCFh0c08ryiUFvyMV%2Fuploads%2FdJ3ftMxCbpw7GvRZWZ63%2Fimage.png?alt=media&amp;token=9a641da0-7269-47de-95ae-4b95c38c778e" alt=""><figcaption><p>Select the file</p></figcaption></figure>

10. Preview the uploaded data and click **Next.**

<figure><img src="https://1781349671-files.gitbook.io/~/files/v0/b/gitbook-x-prod.appspot.com/o/spaces%2FKyXRCFh0c08ryiUFvyMV%2Fuploads%2FT3IJz3cpxDZn1XRiKL6B%2Fimage.png?alt=media&amp;token=bf95abbd-dd08-4c55-88e9-07e841d90bec" alt=""><figcaption><p>Preview Data</p></figcaption></figure>

## Edit Column Properties (Optional)

PowerTable detects column properties automatically. You can edit them if needed. Choose the primary key. You can also add additional columns in this step, using the **Add Column** option. After verifying the details, click **Finish.**

<figure><img src="https://1781349671-files.gitbook.io/~/files/v0/b/gitbook-x-prod.appspot.com/o/spaces%2FKyXRCFh0c08ryiUFvyMV%2Fuploads%2FUN9hzblgpbtupRGktLbY%2Fimage.png?alt=media&amp;token=b3835dc9-71d2-4621-a1c8-f21ef64e6e08" alt=""><figcaption><p>Click 'Finish'</p></figcaption></figure>

You have now successfully built your first app using PowerTable.

<figure><img src="https://1781349671-files.gitbook.io/~/files/v0/b/gitbook-x-prod.appspot.com/o/spaces%2FKyXRCFh0c08ryiUFvyMV%2Fuploads%2FZL03bAmkv1w7gGA2fvIw%2Fimage.png?alt=media&amp;token=7e9ee946-b194-4773-8b12-a40f4712609c" alt=""><figcaption><p>PowerTable app </p></figcaption></figure>

To get the most out of PowerTable, you will need to perform one or more steps listed below. We'll cover them in detail later.

* Configuring field properties
* Defining access control permissions
* Configuring workflow approvals
* Setting up automation including triggers, cascading updates, and email/Microsoft Teams notifications
* ... and more.


# Layout & User Interface

Let us now explore the PowerTable interface. It has the following sections:

<figure><img src="https://1781349671-files.gitbook.io/~/files/v0/b/gitbook-x-prod.appspot.com/o/spaces%2FKyXRCFh0c08ryiUFvyMV%2Fuploads%2F9OOGfPuX1fB0mAwZqQlb%2Fimage.png?alt=media&amp;token=c12e73ea-4089-47aa-9f36-b879799dfeab" alt=""><figcaption><p>PowerTable interface</p></figcaption></figure>

### Menu bar

PowerTable contains the **Home** and the **Setup** menus.

On the right, there are additional tabs for managing column width, approvals, comments, and saving changes.

### Toolbar

The toolbar displays relevant features and settings based on the selected menu.

* The **Home** tab includes the following options: row import, row insertion, appearance and display settings (such as row height, word wrap, and header fit), conditional formatting, sort, search, and filter options, find and replace, audit, and undo/redo operations.

<figure><img src="https://1781349671-files.gitbook.io/~/files/v0/b/gitbook-x-prod.appspot.com/o/spaces%2FKyXRCFh0c08ryiUFvyMV%2Fuploads%2FqV2Y1poEfi5SrPSWTPZm%2Fimage.png?alt=media&amp;token=3cb13669-5cda-45f5-b135-7b52df597901" alt=""><figcaption><p>The Home tab</p></figcaption></figure>

When you select a row or a column, the toolbar displays basic and advanced formatting and editing options, as shown below:

<figure><img src="https://1781349671-files.gitbook.io/~/files/v0/b/gitbook-x-prod.appspot.com/o/spaces%2FKyXRCFh0c08ryiUFvyMV%2Fuploads%2FZ7DUxZ4sRUi3TDyKucop%2Fimage.png?alt=media&amp;token=70903bf0-9e9b-4d40-8021-1ba251b44233" alt=""><figcaption><p>Formatting &#x26; other options </p></figcaption></figure>

* The **Setup** tab enables you to configure column properties, manage row and column access control, create automation workflows, and view and manage table settings.

<figure><img src="https://1781349671-files.gitbook.io/~/files/v0/b/gitbook-x-prod.appspot.com/o/spaces%2FKyXRCFh0c08ryiUFvyMV%2Fuploads%2FH3qp8zau7cooHr9t1KFg%2Fimage.png?alt=media&amp;token=65708742-300b-439e-96ca-cdc346dbe603" alt=""><figcaption><p>The Setup tab</p></figcaption></figure>

### **Table**

This section displays your source table, as well as the results of any editing, sorting, filtering, formatting, commenting, or other actions you perform on it. Here is where you will interact with the data and configure other functionalities that you choose.

<figure><img src="https://1781349671-files.gitbook.io/~/files/v0/b/gitbook-x-prod.appspot.com/o/spaces%2FKyXRCFh0c08ryiUFvyMV%2Fuploads%2FjQURlXkw1IMoAqFd6Efv%2Fimage.png?alt=media&amp;token=2d4e5b51-e2cf-4043-9275-c972f9617606" alt=""><figcaption><p>Table</p></figcaption></figure>

### **Status bar**

The status bar displays source and table information, settings, and pagination controls.&#x20;

<figure><img src="https://1781349671-files.gitbook.io/~/files/v0/b/gitbook-x-prod.appspot.com/o/spaces%2FKyXRCFh0c08ryiUFvyMV%2Fuploads%2FQ4KqMAsPvpqvbZFcdFbn%2Fimage.png?alt=media&amp;token=e203910c-8df1-42f2-b4d4-2064662424cc" alt=""><figcaption><p>Status bar</p></figcaption></figure>

On the left, the total number of rows, columns, the source and table details are displayed.

* **Rows:** The total number of rows in the source table is shown here.
* **Columns:** The total number of columns in the source table is shown here.
* **Source:** The database connection name and the table name are displayed here. Hovering over it displays the complete source details.&#x20;
* **Sync (Data Refresh):** Click on this option to sync your table data with the source data. This is similar to a source data refresh.

{% hint style="info" %}
You need to use the **Save** option to save the new changes and updates you made to the table. Use the **sync** option to refresh table data with database data, which also refreshes any database columns or reference columns added to the table.
{% endhint %}

* **Zoom-in and zoom-out controls:** Users can click on the '+' and '-' icons to zoom in and out, respectively. Alternatively, the Ctrl + and Ctrl - shortcut keys can also be used.

On the right, you can view page display settings and pagination controls:

* **Pagination controls:** Use these controls to go to the first page, previous, next, and last page, and also navigate to a specific page by entering the page number.
* **Settings:** Here, you can choose whether you want the table to span multiple pages or have a scrollbar. It also allows you to change the number of rows displayed per page by selecting 'All', 'Auto', or a specific range from 10 to 75 rows.&#x20;


# Create Table App

There are several ways to create an app with PowerTable:

> [Import your spreadsheet data](/explore-powertable/powertable-product-tour/build-your-first-app) and build an app

> [Connect to an existing database table](/explore-powertable/create-table-app/connect-to-database) and build an app

> [Directly type in data in the app](/explore-powertable/create-table-app/enter-data-manually) and create a table in the database

> [Connect to an existing semantic model](/explore-powertable/create-table-app/connect-to-semantic-model) and build a writeback-enabled app&#x20;

The upcoming sections will demonstrate each of these steps.


# Import Spreadsheet Data

Storing data in a database ensures better scalability, security, and querying capabilities compared to spreadsheets.

PowerTable lets you import your spreadsheet data and transform it into a dynamic table app, seamlessly integrated with your preferred data store.

We have already demonstrated importing spreadsheet data to create our first PowerTable app. You can refer to [this section](/explore-powertable/powertable-product-tour/build-your-first-app) to know the steps.


# Connect to Database

In the previous section, we demonstrated the steps to [build your first app by importing your CSV data](/explore-powertable/powertable-product-tour/build-your-first-app).&#x20;

In this section, we'll connect to your existing database and create an app using PowerTable.

**The source and destination will be the same**, so we will connect to and writeback the changes to the same database. Let us look at the steps.

1. Go to your Microsoft Fabric workspace folder. Click on **New item** to create a new item.

<figure><img src="https://1781349671-files.gitbook.io/~/files/v0/b/gitbook-x-prod.appspot.com/o/spaces%2FKyXRCFh0c08ryiUFvyMV%2Fuploads%2FASlB0JGdM8ShVlROxDE5%2Fimage.png?alt=media&amp;token=24852655-6f2e-4c5d-b910-297d41ee8563" alt=""><figcaption><p>Create a new item</p></figcaption></figure>

2. Select **PowerTable** from the list of items. You may want to add it to your favorites by clicking on the star icon.

<figure><img src="https://1781349671-files.gitbook.io/~/files/v0/b/gitbook-x-prod.appspot.com/o/spaces%2FKyXRCFh0c08ryiUFvyMV%2Fuploads%2F33fohxj2fjNG1tS1NIA0%2Fimage.png?alt=media&amp;token=80ec3f00-8274-4f02-a0ec-6f9ce4b07561" alt=""><figcaption><p>Select 'PowerTable'</p></figcaption></figure>

3. Enter a name for your PowerTable app and select the workspace. Click on **Create.**

<figure><img src="https://1781349671-files.gitbook.io/~/files/v0/b/gitbook-x-prod.appspot.com/o/spaces%2FKyXRCFh0c08ryiUFvyMV%2Fuploads%2FhubNPHTPZcdO5VzagAgT%2Fimage.png?alt=media&amp;token=8dad4135-8c48-44b3-a1b7-f818cff92a90" alt=""><figcaption><p>Create PowerTable item</p></figcaption></figure>

4. Click on **Create a New App** to create your app. You may also select 'Explore PowerTable' to [experience a sample PowerTable app](/explore-powertable/powertable-product-tour/explore-a-sample-app).

<figure><img src="https://1781349671-files.gitbook.io/~/files/v0/b/gitbook-x-prod.appspot.com/o/spaces%2FKyXRCFh0c08ryiUFvyMV%2Fuploads%2FJSupizpBuHqHqIIXCnI0%2Fimage.png?alt=media&amp;token=0775c4e1-e6c7-4238-a267-60424b67df76" alt=""><figcaption><p>Create a New App</p></figcaption></figure>

5. **Choose your data source:** The next step is to select an existing database to connect to. After connecting to it through PowerTable, your app synchronizes its data with the database.&#x20;

Let's say you want to connect to sales data residing in a Microsoft Fabric SQL database. Follow the steps below to create a new connection to your preferred data store:

* Click on **New Connection.**
* Choose your preferred data platform. We'll connect to the Fabric SQL database.
* Click **Next.**

<figure><img src="https://1781349671-files.gitbook.io/~/files/v0/b/gitbook-x-prod.appspot.com/o/spaces%2FKyXRCFh0c08ryiUFvyMV%2Fuploads%2Fq9L49oZ76GOQw72zIK8F%2Fimage.png?alt=media&amp;token=b86fc581-8f12-48af-b45f-bace3ac08970" alt=""><figcaption><p>Creating a new connection</p></figcaption></figure>

{% hint style="info" %}
If you already have shared database connections or a private connection to the required data store, skip step 5. Instead, click on the 'Existing Connection' tab, select the one you want to use, and then click **Next.**
{% endhint %}

<figure><img src="https://1781349671-files.gitbook.io/~/files/v0/b/gitbook-x-prod.appspot.com/o/spaces%2FKyXRCFh0c08ryiUFvyMV%2Fuploads%2FJXyGxnjfMUSI9vJgtUgp%2Fimage.png?alt=media&amp;token=60ded946-6f5e-4213-bfbe-8e90b5d329b9" alt=""><figcaption><p>Choosing an existing connection</p></figcaption></figure>

6. **Setup Connection:** Enter the connection type and a unique connection name. Select the workspace and the database from the list of options and click **Next.** Your new private connection is now created.

<figure><img src="https://1781349671-files.gitbook.io/~/files/v0/b/gitbook-x-prod.appspot.com/o/spaces%2FKyXRCFh0c08ryiUFvyMV%2Fuploads%2FCx7CDgjIz0ubWG3yQ9jh%2Fimage.png?alt=media&amp;token=ce7ad033-64bc-487c-95a0-e6a78268c883" alt=""><figcaption><p>Setup Connection</p></figcaption></figure>

7. **Choose your table:** In this step, you have two options :

   1. Select **Existing Table** to connect to an existing table in the database (or)
   2. Select **New Table** to create a new table in the database.

   Since we want to connect to an existing database, we'll choose **Existing Table.** We'll enter the schema name and the table name 'Sales' to connect to it. Click **Next.**

<figure><img src="https://1781349671-files.gitbook.io/~/files/v0/b/gitbook-x-prod.appspot.com/o/spaces%2FKyXRCFh0c08ryiUFvyMV%2Fuploads%2FYoEkzjzA6BAxn09muQJN%2Fimage.png?alt=media&amp;token=7917ee24-a9bb-46fd-860b-347bd223ef24" alt=""><figcaption><p>Connecting to database</p></figcaption></figure>

8. PowerTable detects column properties automatically. You can edit them if necessary. Select the primary key. After verifying the details, click **Finish.**

<figure><img src="https://1781349671-files.gitbook.io/~/files/v0/b/gitbook-x-prod.appspot.com/o/spaces%2FKyXRCFh0c08ryiUFvyMV%2Fuploads%2F6fiznEApdgk1JdmdTNZK%2Fimage.png?alt=media&amp;token=4e09245a-186c-4c10-987d-b55cc1919404" alt=""><figcaption><p>Click 'Finish'</p></figcaption></figure>

You have now successfully connected to a database and created an app using PowerTable.

<figure><img src="https://1781349671-files.gitbook.io/~/files/v0/b/gitbook-x-prod.appspot.com/o/spaces%2FKyXRCFh0c08ryiUFvyMV%2Fuploads%2F4GtGXICQiq0eWw1pBT7L%2Fimage.png?alt=media&amp;token=4c429a44-9643-4211-b524-91f5d1b5eff8" alt=""><figcaption><p>PowerTable app created</p></figcaption></figure>

You can start working with this data, making changes as needed and configuring access control, workflows, approvals, and other features for your new app. These are covered in the upcoming sections.


# Enter Data Manually

In previous sections, we demonstrated how to [import a CSV file into PowerTable](/explore-powertable/powertable-product-tour/build-your-first-app) and [connect to a database](/explore-powertable/create-table-app/connect-to-database) directly from PowerTable.&#x20;

This section explains how to manually enter data into PowerTable to build an app.&#x20;

**The source and destination will be the same**; we will enter data to create a table and then writeback the subsequent changes to the same database. Let us look at the steps.

1. Go to your Microsoft Fabric workspace folder. Click on **New item** to create a new item.

<figure><img src="https://1781349671-files.gitbook.io/~/files/v0/b/gitbook-x-prod.appspot.com/o/spaces%2FKyXRCFh0c08ryiUFvyMV%2Fuploads%2FASlB0JGdM8ShVlROxDE5%2Fimage.png?alt=media&amp;token=24852655-6f2e-4c5d-b910-297d41ee8563" alt=""><figcaption><p>Create a new item</p></figcaption></figure>

2. Select **PowerTable** from the list of items. You may want to add it to your favorites by clicking on the star icon.

<figure><img src="https://1781349671-files.gitbook.io/~/files/v0/b/gitbook-x-prod.appspot.com/o/spaces%2FKyXRCFh0c08ryiUFvyMV%2Fuploads%2F33fohxj2fjNG1tS1NIA0%2Fimage.png?alt=media&amp;token=80ec3f00-8274-4f02-a0ec-6f9ce4b07561" alt=""><figcaption><p>Select 'PowerTable'</p></figcaption></figure>

3. Enter a name for your PowerTable app and select the workspace. Click on **Create.**

<figure><img src="https://1781349671-files.gitbook.io/~/files/v0/b/gitbook-x-prod.appspot.com/o/spaces%2FKyXRCFh0c08ryiUFvyMV%2Fuploads%2F0Cem66tqsyOPMU2aTqY5%2Fimage.png?alt=media&amp;token=495e4b9b-9766-4f53-9422-50319fbb92aa" alt=""><figcaption><p>Create PowerTable item</p></figcaption></figure>

4. Click on **Create a New App** to create your app. You may also select 'Explore PowerTable' to [experience a sample PowerTable app](/explore-powertable/powertable-product-tour/explore-a-sample-app).

<figure><img src="https://1781349671-files.gitbook.io/~/files/v0/b/gitbook-x-prod.appspot.com/o/spaces%2FKyXRCFh0c08ryiUFvyMV%2Fuploads%2FmRwGghk5AHGeX39Uv54p%2Fimage.png?alt=media&amp;token=11117f1d-0f13-45bc-afa6-cb573487d7b7" alt=""><figcaption><p>Create a New App</p></figcaption></figure>

5. **Creating a new database connection:** The next step is to create a new database connection to your preferred data source. Your app synchronizes its data with this data store. Follow the steps below to create a new connection:

   * Click on **New Connection.**
   * Choose your preferred data platform. We'll connect to the Fabric SQL database.
   * Click **Next.**

   <figure><img src="https://1781349671-files.gitbook.io/~/files/v0/b/gitbook-x-prod.appspot.com/o/spaces%2FKyXRCFh0c08ryiUFvyMV%2Fuploads%2Fa7RhmSNyz8qhBFcMCaYL%2Fimage.png?alt=media&amp;token=d7fccc8a-77fd-4c88-8782-8df5e1c1a130" alt=""><figcaption><p>Creating a new connection</p></figcaption></figure>

{% hint style="info" %}
If you already have shared database connections or a private connection to the required data store, skip step 5. Instead, click on the 'Existing Connection' tab, select the one you want to use, and then click **Next.**
{% endhint %}

<figure><img src="https://1781349671-files.gitbook.io/~/files/v0/b/gitbook-x-prod.appspot.com/o/spaces%2FKyXRCFh0c08ryiUFvyMV%2Fuploads%2FPphyT8JXJTkT4UUB4lAy%2Fimage.png?alt=media&amp;token=a094d6d8-56d3-4b52-9989-67ebdaec0759" alt=""><figcaption><p>Choosing an existing connection</p></figcaption></figure>

6. **Setup Connection:** Enter the connection type and a unique connection name. Select the workspace and the database from the list of options and click **Next.** Your new private connection is now created.

<figure><img src="https://1781349671-files.gitbook.io/~/files/v0/b/gitbook-x-prod.appspot.com/o/spaces%2FKyXRCFh0c08ryiUFvyMV%2Fuploads%2FheC1catj3TFxm8azxtZw%2Fimage.png?alt=media&amp;token=ce5dc271-2a94-4f89-af29-aa63cd318962" alt=""><figcaption><p>Setup Connection</p></figcaption></figure>

7. **Choose your table where the data will be stored:** Here, you have two options:

   1. Select **Existing Table** to connect to an existing table in the database (or)
   2. Select **New Table** to create a new table in the database.

   We'll select **New Table** to create a new table and type in the data.

<figure><img src="https://1781349671-files.gitbook.io/~/files/v0/b/gitbook-x-prod.appspot.com/o/spaces%2FKyXRCFh0c08ryiUFvyMV%2Fuploads%2F3pUTlkFhpWZ7zMb9fbVl%2Fimage.png?alt=media&amp;token=26e86495-6fb0-441d-b2c5-d47de4d5cd28" alt=""><figcaption><p>Create new table</p></figcaption></figure>

8. Select the schema and enter a name for your table. Choose the option **Enter Data Manually** to manually enter the data. Click **Next.**

<figure><img src="https://1781349671-files.gitbook.io/~/files/v0/b/gitbook-x-prod.appspot.com/o/spaces%2FKyXRCFh0c08ryiUFvyMV%2Fuploads%2FZhZxarWpYd2lnynBOtML%2Fimage.png?alt=media&amp;token=8da8b2cf-5a97-41b8-bb0c-78d8b2b5cd0b" alt=""><figcaption><p>Enter table name</p></figcaption></figure>

9. **Add Column Details:** Start creating your table by adding the column name, primary key, and other relevant details like length, precision, scale, etc., wherever applicable.

<figure><img src="https://1781349671-files.gitbook.io/~/files/v0/b/gitbook-x-prod.appspot.com/o/spaces%2FKyXRCFh0c08ryiUFvyMV%2Fuploads%2FxYjC6Cua9jvBAcpiTP1m%2Fimage.png?alt=media&amp;token=ad98c54f-55d6-4733-8eb9-1a9f9abe8db5" alt=""><figcaption><p>Add Column details</p></figcaption></figure>

10. **Add Column:** Click on '+ Add Column' at the top to add a new field/column.

<figure><img src="https://1781349671-files.gitbook.io/~/files/v0/b/gitbook-x-prod.appspot.com/o/spaces%2FKyXRCFh0c08ryiUFvyMV%2Fuploads%2FiYDIrYunNekmlfHt7fUJ%2Fimage.png?alt=media&amp;token=ea186a9e-90f4-453e-9b39-aa6f3289e257" alt=""><figcaption><p>Add Column</p></figcaption></figure>

11. You can use the bin icon to delete a column.

<figure><img src="https://1781349671-files.gitbook.io/~/files/v0/b/gitbook-x-prod.appspot.com/o/spaces%2FKyXRCFh0c08ryiUFvyMV%2Fuploads%2Fu4A4xp2n00GWrXOCcTUY%2Fimage.png?alt=media&amp;token=950d3f87-1fe1-4178-b4dd-8828091dbea0" alt=""><figcaption><p>Deleting a column</p></figcaption></figure>

12. Click **Finish** after entering all the column details.

<figure><img src="https://1781349671-files.gitbook.io/~/files/v0/b/gitbook-x-prod.appspot.com/o/spaces%2FKyXRCFh0c08ryiUFvyMV%2Fuploads%2FrdaTYRmhL5qmM9uhxBqa%2Fimage.png?alt=media&amp;token=293b932a-8400-4a44-b6c5-06a255cc1fc9" alt=""><figcaption><p>click 'Finish'</p></figcaption></figure>

The table has been successfully created using PowerTable, with the configured columns.

<figure><img src="https://1781349671-files.gitbook.io/~/files/v0/b/gitbook-x-prod.appspot.com/o/spaces%2FKyXRCFh0c08ryiUFvyMV%2Fuploads%2F2KwWxHr2eOgZRf9k82mk%2Fimage.png?alt=media&amp;token=875ee0a9-309b-48a0-818e-7802edcebc55" alt=""><figcaption><p>Table created</p></figcaption></figure>

You can now insert rows into this table using the **Insert Row** option.

<figure><img src="https://1781349671-files.gitbook.io/~/files/v0/b/gitbook-x-prod.appspot.com/o/spaces%2FKyXRCFh0c08ryiUFvyMV%2Fuploads%2FtfOwdVGrgNECfIfv7oxu%2Fimage.png?alt=media&amp;token=ec6daf2a-fd6d-4a75-9f64-97510f9c9005" alt=""><figcaption><p>Inserting rows into the table</p></figcaption></figure>

With this table app, you can start working on your data, adjusting it as necessary and setting up features like approvals, workflows, and access control. These are covered in the following sections.


# Connect to Semantic Model

This section explains the steps to connecting to data in a semantic model.

PowerTable allows you to connect to an existing semantic model and create an app. The data table, along with any changes or updates, is written back to your preferred data platforms.

In this case, **the source and destination are different.**

The steps are as follows:

1. Go to your Microsoft Fabric workspace folder. Click on **New item** to create a new item.

<figure><img src="https://1781349671-files.gitbook.io/~/files/v0/b/gitbook-x-prod.appspot.com/o/spaces%2FKyXRCFh0c08ryiUFvyMV%2Fuploads%2FVTStTipzvXybwBjTtmD7%2Fimage.png?alt=media&amp;token=82028526-36b2-486f-925b-0f7cfb11d7a2" alt=""><figcaption><p>Create a new item</p></figcaption></figure>

2. Select **PowerTable** from the list of items. You may want to add it to your favorites by clicking on the star icon.

<figure><img src="https://1781349671-files.gitbook.io/~/files/v0/b/gitbook-x-prod.appspot.com/o/spaces%2FKyXRCFh0c08ryiUFvyMV%2Fuploads%2F33fohxj2fjNG1tS1NIA0%2Fimage.png?alt=media&amp;token=80ec3f00-8274-4f02-a0ec-6f9ce4b07561" alt=""><figcaption><p>Select 'PowerTable'</p></figcaption></figure>

3. Enter a name for your PowerTable app and select the workspace. Click on **Create.**

<figure><img src="https://1781349671-files.gitbook.io/~/files/v0/b/gitbook-x-prod.appspot.com/o/spaces%2FKyXRCFh0c08ryiUFvyMV%2Fuploads%2FhubNPHTPZcdO5VzagAgT%2Fimage.png?alt=media&amp;token=8dad4135-8c48-44b3-a1b7-f818cff92a90" alt=""><figcaption><p>Create PowerTable item</p></figcaption></figure>

4. Click on **Create a New App** to create your app. You may also select 'Explore PowerTable' to [experience a sample PowerTable app](/explore-powertable/powertable-product-tour/explore-a-sample-app).

<figure><img src="https://1781349671-files.gitbook.io/~/files/v0/b/gitbook-x-prod.appspot.com/o/spaces%2FKyXRCFh0c08ryiUFvyMV%2Fuploads%2FJSupizpBuHqHqIIXCnI0%2Fimage.png?alt=media&amp;token=0775c4e1-e6c7-4238-a267-60424b67df76" alt=""><figcaption><p>Create a New App</p></figcaption></figure>

5. **Creating a new database connection:** The next step is to create a new database connection to your preferred data source. Your app **writes back** its data to this data store destination. Follow the steps below to create a new connection:

* Click on **New Connection.**
* Choose your preferred data platform. We'll connect to the Fabric SQL database for writeback.
* Click **Next.**

<figure><img src="https://1781349671-files.gitbook.io/~/files/v0/b/gitbook-x-prod.appspot.com/o/spaces%2FKyXRCFh0c08ryiUFvyMV%2Fuploads%2Fq9L49oZ76GOQw72zIK8F%2Fimage.png?alt=media&amp;token=b86fc581-8f12-48af-b45f-bace3ac08970" alt=""><figcaption><p>Creating a new connection</p></figcaption></figure>

{% hint style="info" %}
If you already have shared database connections or a private connection to the required data store, skip step 5. Instead, click on the 'Existing Connection' tab, select the one you want to use, and then click **Next.**
{% endhint %}

<figure><img src="https://1781349671-files.gitbook.io/~/files/v0/b/gitbook-x-prod.appspot.com/o/spaces%2FKyXRCFh0c08ryiUFvyMV%2Fuploads%2FPphyT8JXJTkT4UUB4lAy%2Fimage.png?alt=media&amp;token=a094d6d8-56d3-4b52-9989-67ebdaec0759" alt=""><figcaption><p>Choosing an existing connection</p></figcaption></figure>

6. **Setup Connection:** Enter the connection type and a unique connection name. Select the workspace and the database from the list of options and click **Next.** Your new private connection is now created.

<figure><img src="https://1781349671-files.gitbook.io/~/files/v0/b/gitbook-x-prod.appspot.com/o/spaces%2FKyXRCFh0c08ryiUFvyMV%2Fuploads%2FsKmpqxkB47U4PvqUBWg3%2Fimage.png?alt=media&amp;token=c2b6e925-f7ea-40a9-9234-9f979d97da86" alt=""><figcaption><p>Setup Connection</p></figcaption></figure>

7. **Select your table where the data will be stored/written back:** Here, you have two options:

   1. Select **Existing Table** to connect to an existing table in the database (or)
   2. Select **New Table** to create a new table in the database.

   We'll select **New Table** to create a new table where we will writeback the source data acquired from the semantic model.

<figure><img src="https://1781349671-files.gitbook.io/~/files/v0/b/gitbook-x-prod.appspot.com/o/spaces%2FKyXRCFh0c08ryiUFvyMV%2Fuploads%2FU1VU2DADE30ttMn61xrp%2Fimage.png?alt=media&amp;token=b696a326-2b27-481a-9deb-f390d8b4e778" alt=""><figcaption><p>Create new table</p></figcaption></figure>

8. Enter the following details:

* **Schema and Table Name:** Select the schema and enter a name for the table.&#x20;
* **Import Data:** Choose the option **Connect To Semantic Model.**&#x20;
* **Workspace and Semantic Model:** Enter the name of the workspace in which your semantic model exists, as well as the name of the semantic model you want to connect to and get data from. Click **Next.**

<figure><img src="https://1781349671-files.gitbook.io/~/files/v0/b/gitbook-x-prod.appspot.com/o/spaces%2FKyXRCFh0c08ryiUFvyMV%2Fuploads%2FZXzYq2ZTFq3lYdErjcYy%2Fimage.png?alt=media&amp;token=fdaf2bbe-9d7b-4a36-b65d-294bd6d60e5b" alt=""><figcaption><p>Connect to semantic model</p></figcaption></figure>

{% hint style="info" %}
Capacity workspaces with Pro licences are not supported. Please make sure to select a workspace of premium capacity.
{% endhint %}

9. **Map Data:** The next step is to map and assign your data. Assign the required fields and values to the table.

<figure><img src="https://1781349671-files.gitbook.io/~/files/v0/b/gitbook-x-prod.appspot.com/o/spaces%2FKyXRCFh0c08ryiUFvyMV%2Fuploads%2FfVnBrxsp8qB17K5VYyC8%2Fimage.png?alt=media&amp;token=33137bdd-2109-4893-8b07-5b18ed20b14a" alt=""><figcaption><p>Assign fields and values</p></figcaption></figure>

10. **Filter:** You can use the filter to select specific fields in the table, if necessary.

<figure><img src="https://1781349671-files.gitbook.io/~/files/v0/b/gitbook-x-prod.appspot.com/o/spaces%2FKyXRCFh0c08ryiUFvyMV%2Fuploads%2FtslingBQ0zBPTBTff4tv%2Fimage.png?alt=media&amp;token=a45bd2b1-71a2-429d-885b-abace1ca5a6f" alt=""><figcaption><p>Filter required fields</p></figcaption></figure>

11. **Schedule Refresh:** You can also schedule periodic data source refreshes to ensure your data is up to date with the semantic model.

To schedule a refresh, enable the toggle. Then, set the refresh frequency, scheduled duration and time, time zone, and option to skip specified calendar holidays. Click **Next** after previewing the data.

<figure><img src="https://1781349671-files.gitbook.io/~/files/v0/b/gitbook-x-prod.appspot.com/o/spaces%2FKyXRCFh0c08ryiUFvyMV%2Fuploads%2FDLHQmGD5FAGWGikBluCc%2Fimage.png?alt=media&amp;token=085802a8-b208-4415-94f4-1ceb935cfab7" alt=""><figcaption><p>Schedule refresh</p></figcaption></figure>

12. PowerTable automatically detects the fields' data and input types and the primary key. You can edit them, if necessary. You can also add additional columns in this step, using the **Add Column** option. After verifying the details, click **Finish.**

<figure><img src="https://1781349671-files.gitbook.io/~/files/v0/b/gitbook-x-prod.appspot.com/o/spaces%2FKyXRCFh0c08ryiUFvyMV%2Fuploads%2FtS8a4Zoju9cDo0nCaFEu%2Fimage.png?alt=media&amp;token=30b66721-1f07-484f-b07a-276a2676b288" alt=""><figcaption><p>Configure Table</p></figcaption></figure>

The table app has been successfully created using PowerTable, with the configured columns and values.

<figure><img src="https://1781349671-files.gitbook.io/~/files/v0/b/gitbook-x-prod.appspot.com/o/spaces%2FKyXRCFh0c08ryiUFvyMV%2Fuploads%2FWD4s20VP02MrDrFJUqoh%2Fimage.png?alt=media&amp;token=b371fc68-94b3-4e7d-a98f-789816bffa7b" alt=""><figcaption><p>Table app created</p></figcaption></figure>

You can start working with this data and make changes as needed. The changes are written back to the configured data platform destination.&#x20;

You can configure access control, workflows, approvals, automation and other features for your new app. These are covered in the upcoming sections.


# Working with PowerTable

This section describes some of the actions you can perform with your table app, such as configuring fields, editing data, adding or deleting rows, importing records from files, bulk editing, sorting, filtering, conditional formatting, and so on.

In the subsequent sections, you can explore other advanced topics such as setting up access control for rows and columns, approval flows, forms, etc.

Let's start with column setup in the next section.


# Column Setup

This section guides you on how to add new columns to your table and configure column properties such as the input type, constraints, default values, lookup values, display name, and other column attributes, such as column width and access control. Explore them below:

* **Adding New Columns:**
  * [Visual Column](/explore-powertable/working-with-powertable/column-setup/add-visual-column)
  * [Formula Column](/explore-powertable/working-with-powertable/column-setup/add-formula-column)
  * [Database Column](/explore-powertable/working-with-powertable/column-setup/add-database-column)
* [Configure Column Properties](/explore-powertable/working-with-powertable/column-setup/configure-column-properties)
* [Manage Column Width, Access & Other Settings](/explore-powertable/working-with-powertable/column-setup/manage-columns)
* [Column Width Adjustment Settings](/explore-powertable/working-with-powertable/column-setup/change-column-widths)

#### PowerTable allows you to add and work with columns with the following data types:

#### Database Columns

<table data-header-hidden><thead><tr><th width="160.111083984375">Field type</th><th>Description</th></tr></thead><tbody><tr><td><strong>Number</strong></td><td>The number field type is intended to hold numerical values such as the number of stocks available, employee salaries, and so on.</td></tr><tr><td><strong>Text</strong></td><td>The text field type can hold variable-length string of characters, including letters, numbers, and special symbols. Examples include product or employee names, their details or descriptions, etc.</td></tr><tr><td><strong>Options - Single select</strong></td><td>A single select field is ideal when you want to be able to select a single option from a preset list of options.</td></tr><tr><td><strong>Checkbox</strong></td><td>A checkbox field is useful to indicate true/false values or a toggle within a record.</td></tr><tr><td><strong>Image</strong></td><td>An image field allows you to store a single image URL for each record and display a miniature of the image in each cell.</td></tr><tr><td><strong>Person</strong></td><td>A Person field type allows you to store a single user's email address in each cell, either as the person's name or email ID. When you click on this type of cell, you will see a drop-down list of all users in your organization's Microsoft Entra ID.</td></tr><tr><td><strong>URL</strong></td><td>A URL field is intended to store a single URL in each cell. Clicking on a URL takes you to that URL.</td></tr><tr><td><strong>Email</strong></td><td>An email field is intended to store a single email address in each cell.</td></tr><tr><td><strong>Phone number</strong></td><td>A phone number field allows you to save phone numbers for each record. A leading +, spaces, parentheses, and numbers 0–9 up to 15 digits are supported.</td></tr><tr><td><strong>Currency</strong></td><td>A currency field is a specific <strong>number-type field</strong> that formats the number as a currency amount. E.g., when you select 'Currency' as the input type for the number field and 'US Dollar' as the currency type, 3000.5 will be formatted as $3,000.5. All global currencies are supported.</td></tr><tr><td><strong>Rating</strong></td><td>The rating field is a <strong>number-type field</strong> that can be used for whole numbers (INT). It allows you to assign ratings to your records for ranking or quality assessment purposes. Three different style formats are available for indicating ratings. </td></tr><tr><td>Multiple select</td><td>A multiple select field is similar to a single select field; it allows you to select predetermined options from a list. Unlike a single select field, however, you can select as many options as you'd like per cell.</td></tr><tr><td><strong>Button</strong></td><td>The button field adds interactivity to your record, such as opening a URL or executing an automation. Create clickable buttons to open a URL or execute a defined action.</td></tr><tr><td>Date &#x26; Time</td><td>A date field allows you to easily enter a date and optionally a time into a cell. When editing a date time, you will be presented with a calendar widget that makes it easy to select a specific date.</td></tr><tr><td>Formula</td><td>Formulas allow you to compute a value in each record based on other cells in that same record.</td></tr><tr><td>Lookup</td><td>A lookup field allows you to look up a specific field in a linked record.</td></tr><tr><td>Percent</td><td>The percent field type is a field type designed to hold numerical values formatted as percents. The values in a percent field are all represented as fractions of 100 with the percent sign; e.g. the number .75 in a percent field is represented as 75%.</td></tr></tbody></table>

* Decimal
* Date Time
* Date
* Image
* Person

The number column type can also be customized to have ratings in the form of icons and stars, as seen on common e-commerce sites.

Further, you can configure additional properties based on the selected input type—such as constraints, scaling, etc., which are covered in the upcoming sections.&#x20;


# Adding Columns - Overview

With growing business requirements, the need to add new columns to your table can arise more often than not. PowerTable allows you to add new columns to an existing table on the fly to accommodate your changing needs.&#x20;

A new column can be added to a table in two scenarios:

1. **While creating a new table:**

The **Add Column** option comes in handy during the initial table configuration step, using which you can add and configure a new column in addition to the imported columns.

<figure><img src="https://1781349671-files.gitbook.io/~/files/v0/b/gitbook-x-prod.appspot.com/o/spaces%2FKyXRCFh0c08ryiUFvyMV%2Fuploads%2FJlIeF2qJefrYmD3Bhg10%2Fimage.png?alt=media&amp;token=9b24dd10-5d15-47a8-b038-e01c732ba352" alt=""><figcaption></figcaption></figure>

2. **While working with an existing table that you have already created or connected to:**&#x20;

You can add a column at any time after creating or connecting to a table using one of the options highlighted below.

<figure><img src="https://1781349671-files.gitbook.io/~/files/v0/b/gitbook-x-prod.appspot.com/o/spaces%2FKyXRCFh0c08ryiUFvyMV%2Fuploads%2FNAYFAwCz44bcl9uUGKpF%2Fimage.png?alt=media&amp;token=165b9326-52f1-438a-8405-ecc33dae6088" alt=""><figcaption></figcaption></figure>

In the next sections, we will go over how to add a visual column, a formula column, and a database column to your existing table.&#x20;

* [**Visual column:**](/explore-powertable/working-with-powertable/column-setup/add-visual-column) These are columns that are added on the visual level and are available only in the PowerTable item. These include [multi-select relationship columns](/explore-powertable/working-with-powertable/column-setup/add-visual-column/multi-select-relationship-column), [reference columns](/explore-powertable/working-with-powertable/column-setup/add-visual-column/reference-column), [relation columns](/explore-powertable/working-with-powertable/column-setup/add-visual-column/relation-column), and button-type columns.
* [**Formula column:**](/explore-powertable/working-with-powertable/column-setup/add-formula-column) These are calculated columns that you can include in the table. PowerTable supports a wide range of Excel-like formulas and functions, which you can use to create the calculated columns.
* [**Database column:**](/explore-powertable/working-with-powertable/column-setup/add-database-column) These are columns that are directly added to the source database via PowerTable.&#x20;


# Add Visual Column

The **Add Visual Column** option lets you insert new columns to the table visually. While these columns are configured and saved in the PowerTable item, they **would not be added to the database**. Visual columns include:

* [Multi-select Relationship column](/explore-powertable/working-with-powertable/column-setup/add-visual-column/multi-select-relationship-column)
* [Reference column](/explore-powertable/working-with-powertable/column-setup/add-visual-column/reference-column)
* [Relation column](/explore-powertable/working-with-powertable/column-setup/add-visual-column/relation-column)
* [Button column](/explore-powertable/working-with-powertable/column-setup/add-visual-column/button-column)

<figure><img src="https://1781349671-files.gitbook.io/~/files/v0/b/gitbook-x-prod.appspot.com/o/spaces%2FKyXRCFh0c08ryiUFvyMV%2Fuploads%2FdO9ykJNEVxv1ryP68bMO%2Fimage.png?alt=media&amp;token=0488b6ce-8cbd-4468-8783-78416e0ef469" alt=""><figcaption><p>You can add any of these visual columns</p></figcaption></figure>

These are explained in detail in the next sections.


# Multi-select Relationship Column

A multi-select column allows users to select and enter multiple values for a single record in the field.

PowerTable allows you to add multi-select columns sourced from related tables. You can configure the multiple entries for a field to be retrieved from another table in the database.

To insert a multi-select visual column, follow the steps below.

Let us consider adding the 'Sales Rep' column to the 'Products' table, which allows users to enter sales representatives for each product.

1. Go to **Setup > Columns.**

<figure><img src="https://1781349671-files.gitbook.io/~/files/v0/b/gitbook-x-prod.appspot.com/o/spaces%2FKyXRCFh0c08ryiUFvyMV%2Fuploads%2FA6YxIAqb1N2YBAztLXWr%2Fimage.png?alt=media&amp;token=1f4af3ea-7fde-4d41-9fe2-c8d6c992491e" alt=""><figcaption><p>Setup > Columns</p></figcaption></figure>

2. Select **Add Visual Column > Add Multi-select Relationship Column.**

<figure><img src="https://1781349671-files.gitbook.io/~/files/v0/b/gitbook-x-prod.appspot.com/o/spaces%2FKyXRCFh0c08ryiUFvyMV%2Fuploads%2Fl5jr8ct9Eo6LD3FGCBI6%2Fimage.png?alt=media&amp;token=2a47f115-d744-4a1a-93e9-b5a77d3caa04" alt=""><figcaption><p>Add multi-select column</p></figcaption></figure>

Alternatively, you can insert a new column from the 'Home' tab, as shown below:

<figure><img src="https://1781349671-files.gitbook.io/~/files/v0/b/gitbook-x-prod.appspot.com/o/spaces%2FKyXRCFh0c08ryiUFvyMV%2Fuploads%2FTLnOSND2vTCHUFC1Mu78%2Fimage.png?alt=media&amp;token=a5108306-9760-45c3-8d7c-019e1398b367" alt=""><figcaption></figcaption></figure>

3. Enter the column name.&#x20;

Let's add a 'Sales Rep' column that will allow users to assign multiple sales representatives to each product in the 'Products' table.

<figure><img src="https://1781349671-files.gitbook.io/~/files/v0/b/gitbook-x-prod.appspot.com/o/spaces%2FKyXRCFh0c08ryiUFvyMV%2Fuploads%2FSajBJx1VT0owT1wojK2u%2Fimage.png?alt=media&amp;token=92aaf5a4-b482-4fb4-974f-4651bb37f61d" alt=""><figcaption></figcaption></figure>

4. The sales representative details are available in another table with the 'Sales Rep Key' field and other fields.

<figure><img src="https://1781349671-files.gitbook.io/~/files/v0/b/gitbook-x-prod.appspot.com/o/spaces%2FKyXRCFh0c08ryiUFvyMV%2Fuploads%2FQQvlH2hpn9i7YioAQLYp%2Fimage.png?alt=media&amp;token=1a52cfe4-1b1f-42d4-9661-fb983f1a6ac4" alt=""><figcaption><p>Sales Rep Table</p></figcaption></figure>

{% hint style="info" %}
Note that a separate relationship table must exist in the database with these three fields—Primary ID, Product Key, Sales Rep Key.&#x20;

If you do not already have a relationship table, create one manually using PowerTable\
(using the ‘New Table’ option)
{% endhint %}

5. Enter the lookup table details from which you want to look up and retrieve values.

We would like to get the first names of sales representatives from the 'Sales Rep Table' and display the list in the dropdown.

<figure><img src="https://1781349671-files.gitbook.io/~/files/v0/b/gitbook-x-prod.appspot.com/o/spaces%2FKyXRCFh0c08ryiUFvyMV%2Fuploads%2FrlhE6zwjTErKVZHAC7DH%2Fimage.png?alt=media&amp;token=b7e58752-d327-4bae-98f2-db2256639806" alt=""><figcaption><p>Lookup table details</p></figcaption></figure>

6. Let us now set up the relation table. Enter the name of the relation table, the corresponding reference column to map the lookup key values in the relation table, and the identifier column details that match the primary keys of the current and relation tables.&#x20;

<figure><img src="https://1781349671-files.gitbook.io/~/files/v0/b/gitbook-x-prod.appspot.com/o/spaces%2FKyXRCFh0c08ryiUFvyMV%2Fuploads%2FIGdKZVsyjm2OB6gyvmPb%2Fimage.png?alt=media&amp;token=c0aaafd8-d1fc-4dc4-b3f4-a39af0a34bce" alt=""><figcaption><p>Relation table details</p></figcaption></figure>

This stores or updates the mapping between products and sales reps in the relationship table as we assign and unassign sales reps to the products in the app. Click **Save.**

We have now successfully added a multi-select relationship column, which allows you to select and assign multiple sales representatives to each product.

<figure><img src="https://1781349671-files.gitbook.io/~/files/v0/b/gitbook-x-prod.appspot.com/o/spaces%2FKyXRCFh0c08ryiUFvyMV%2Fuploads%2FkaCHvk2ltl0uRAhQlaUH%2Fimage.png?alt=media&amp;token=99ea4480-941e-43bd-9885-fcda35546dbc" alt=""><figcaption><p>Multi-select relationship column</p></figcaption></figure>

After assigning, you can click **Save** and **Proceed** to save your changes to the database.

<figure><img src="https://1781349671-files.gitbook.io/~/files/v0/b/gitbook-x-prod.appspot.com/o/spaces%2FKyXRCFh0c08ryiUFvyMV%2Fuploads%2Ft02wNEO6dbBxUqWeEv93%2Fimage.png?alt=media&amp;token=dfd37252-859f-46d8-9305-e3614a986e2b" alt=""><figcaption><p>Save changes</p></figcaption></figure>

The relation table is also simultaneously updated based on the selected values.


# Reference Column

Adding a reference column involves connecting one table to another based on matching columns, enabling you to reference the required columnar data from the connected tables for each record.

When you have multiple tables with a few shared columns, you can easily add reference columns to refer to data from the connected tables.

#### To add a reference column:

1. Go to **Setup > Columns.**

<figure><img src="https://1781349671-files.gitbook.io/~/files/v0/b/gitbook-x-prod.appspot.com/o/spaces%2FKyXRCFh0c08ryiUFvyMV%2Fuploads%2FA6YxIAqb1N2YBAztLXWr%2Fimage.png?alt=media&amp;token=1f4af3ea-7fde-4d41-9fe2-c8d6c992491e" alt=""><figcaption><p>Setup > Columns</p></figcaption></figure>

2. Click **Add Visual Column > Add Reference Column.**

<figure><img src="https://1781349671-files.gitbook.io/~/files/v0/b/gitbook-x-prod.appspot.com/o/spaces%2FKyXRCFh0c08ryiUFvyMV%2Fuploads%2F8bgoAESafve284VenqoD%2Fimage.png?alt=media&amp;token=f1a355c3-fb4e-4043-9827-3b5d1a38e8d4" alt=""><figcaption><p>Add Reference Column</p></figcaption></figure>

Alternatively, you can insert a new column from the 'Home' tab, as shown below:

<figure><img src="https://1781349671-files.gitbook.io/~/files/v0/b/gitbook-x-prod.appspot.com/o/spaces%2FKyXRCFh0c08ryiUFvyMV%2Fuploads%2Fu6RwTHCtxShEIv1TKPOl%2Fimage.png?alt=media&amp;token=649babfe-2440-4ae7-8b32-d2e75be5a9fc" alt=""><figcaption></figcaption></figure>

3. Enter the name of your visual column. We want to include the order date, so we enter the name 'Order Date'. We can also change the type to 'Date'.

<figure><img src="https://1781349671-files.gitbook.io/~/files/v0/b/gitbook-x-prod.appspot.com/o/spaces%2FKyXRCFh0c08ryiUFvyMV%2Fuploads%2F8jeLoMSo7NGiJM4PYiXC%2Fimage.png?alt=media&amp;token=d2332cf4-4a74-4982-ac4a-7e6d1402fd2d" alt=""><figcaption><p>Type and Column Name</p></figcaption></figure>

4. Let us now enter the column and table details that we want to refer to. Enter the connection details, schema name, reference table name, column to be referenced, and the column that corresponds to both current and reference tables. Click **Save.**

In the example below, we have referred to the 'Orderdate' column from the 'Sales' table, whose connection details we have entered.

<figure><img src="https://1781349671-files.gitbook.io/~/files/v0/b/gitbook-x-prod.appspot.com/o/spaces%2FKyXRCFh0c08ryiUFvyMV%2Fuploads%2FOw70qZQlLwrPm2ClJcFd%2Fimage.png?alt=media&amp;token=0b7677b5-de4b-4739-bf3d-52647b53e82b" alt=""><figcaption><p>Table details</p></figcaption></figure>

The visual column is added to the table, and it looks as shown below:

<figure><img src="https://1781349671-files.gitbook.io/~/files/v0/b/gitbook-x-prod.appspot.com/o/spaces%2FKyXRCFh0c08ryiUFvyMV%2Fuploads%2FmheZKP7fn6Xg0tG2fly2%2Fimage.png?alt=media&amp;token=e32baf0a-3d2c-416c-9763-d2e88e03883b" alt=""><figcaption><p>Reference column added</p></figcaption></figure>

Reference columns are non-editable, and their values only change when the underlying column values change.


# Relation Column

Use the relation column to connect a master table (also called a parent table) to its detail/child tables. A relation column links multiple records from one child table to a single record in the master table.&#x20;

This is called a [**master-detail relationship**](/explore-powertable/master-detail-tables-parent-child-linked-records). [This section](/explore-powertable/master-detail-tables-parent-child-linked-records/creating-master-detail-tables) explains in detail the steps to include a relation column that establishes such a relationship between multiple tables.


# Button Column

A button column is an interactive column that can be added to your table and configured to open a URL or execute an [automation](/explore-powertable/automation).

1. To add a new column, go to **Setup > Columns.**

<figure><img src="https://1781349671-files.gitbook.io/~/files/v0/b/gitbook-x-prod.appspot.com/o/spaces%2FKyXRCFh0c08ryiUFvyMV%2Fuploads%2FHS9NYWHwUX1GjncZYLPj%2Fimage.png?alt=media&amp;token=077d7548-c7c1-4124-985a-644c9f76b0b5" alt=""><figcaption><p>Set up column</p></figcaption></figure>

2. Click **Add Visual Column > Add Button Column.**&#x20;

<figure><img src="https://1781349671-files.gitbook.io/~/files/v0/b/gitbook-x-prod.appspot.com/o/spaces%2FKyXRCFh0c08ryiUFvyMV%2Fuploads%2FB3cSKzthXnubvGIv9Svr%2Fimage.png?alt=media&amp;token=7e5d4d5b-fe93-4efd-8acd-a55f85989378" alt=""><figcaption><p>Add button column</p></figcaption></figure>

Alternatively, you can insert a new column from the 'Home' tab, as shown below:

<figure><img src="https://1781349671-files.gitbook.io/~/files/v0/b/gitbook-x-prod.appspot.com/o/spaces%2FKyXRCFh0c08ryiUFvyMV%2Fuploads%2F9BkKYp0WsCImJRlwK0D8%2Fimage.png?alt=media&amp;token=2e7b5535-77c1-4038-bddc-c660130ac9c3" alt=""><figcaption></figcaption></figure>

3. Enter the details about the column:

* **Column Name:** Enter a name for the column.
* **Label:** The default label is 'Click Here'. If necessary, you can edit the label for the displayed link.
* **Action:** Choose the action you want PowerTable to perform when you click the link. You can choose to open a URL or execute an automation, as required.

<figure><img src="https://1781349671-files.gitbook.io/~/files/v0/b/gitbook-x-prod.appspot.com/o/spaces%2FKyXRCFh0c08ryiUFvyMV%2Fuploads%2FatxYqziNbkoWeXdpnyRk%2Fimage.png?alt=media&amp;token=62d0a7dd-231b-4871-a5de-6dd998fd1e66" alt=""><figcaption><p>Column Details</p></figcaption></figure>

4. **URL:** If you choose to open a URL, enter the URL details in the section below. Choose **Static** to enter a static URL, or **Formula** to enter a formula to generate a dynamic URL based on data.

#### Static URL - example

<figure><img src="https://1781349671-files.gitbook.io/~/files/v0/b/gitbook-x-prod.appspot.com/o/spaces%2FKyXRCFh0c08ryiUFvyMV%2Fuploads%2Fmbgjon5kFEzihfZlX9pI%2Fimage.png?alt=media&amp;token=cc1c48d1-e4bc-47bd-a1a4-6965b3f0a6b3" alt=""><figcaption></figcaption></figure>

#### Formula - example

<figure><img src="https://1781349671-files.gitbook.io/~/files/v0/b/gitbook-x-prod.appspot.com/o/spaces%2FKyXRCFh0c08ryiUFvyMV%2Fuploads%2FuFf9lQ1cG8hmI9C36Qts%2Fimage.png?alt=media&amp;token=ad19290a-e89e-401b-8ff5-e74d418a7c9d" alt=""><figcaption></figcaption></figure>

5. Click **Save.** The button column is added as shown below:

<figure><img src="https://1781349671-files.gitbook.io/~/files/v0/b/gitbook-x-prod.appspot.com/o/spaces%2FKyXRCFh0c08ryiUFvyMV%2Fuploads%2FBv0i6rSDCQtsEFkrNKAX%2Fimage.png?alt=media&amp;token=c509007c-664e-46c5-98c7-052b82916987" alt=""><figcaption></figcaption></figure>


# Attachments Column

You can attach multiple files directly to records, streamlining your reviews, discussions, and collaboration.

By combining this feature with PowerTable's commenting and approval workflow capabilities, your team can now centralize feedback, track updates, discuss, collaborate, and manage asset approvals—all without leaving PowerTable. Say goodbye to scattered tools and enjoy a more efficient, integrated workflow for your digital assets.

<figure><img src="https://1781349671-files.gitbook.io/~/files/v0/b/gitbook-x-prod.appspot.com/o/spaces%2FKyXRCFh0c08ryiUFvyMV%2Fuploads%2FHU4i1CrVOeSFyfG00e5F%2Fimage.png?alt=media&amp;token=8b05f7c3-7ed1-4b3a-8913-7aba26757ef8" alt=""><figcaption><p>Attachment Column</p></figcaption></figure>

What's in?

* Add file attachments directly to table records from your local system.
* The maximum size supported for each file is 25 MB. There is no theoretical limit to the number of files you can attach to a record.
* Access to these files is governed by [row access permissions.](https://docs.powertable.com/explore-powertable/working-with-powertable/column-setup/add-visual-column/pages/zDmYsHLaOQ7uXJjBcZUz#id-2.-update)
* PowerTable users with relevant row access can download and save these files to their system.

The supported file types for attachments are listed [here](/explore-powertable/working-with-powertable/column-setup/add-visual-column/attachments-column/supported-file-types-for-attachments).


# Supported file types for attachments

<table data-full-width="false"><thead><tr><th width="143.5">File Extension</th><th width="261">Description</th><th width="656">MIME type</th></tr></thead><tbody><tr><td>.3gp</td><td>3GPP multimedia file</td><td>video/3gpp</td></tr><tr><td>.3g2</td><td>3GPP2 multimedia file</td><td>video/3gpp2</td></tr><tr><td>.7z</td><td>7-Zip compressed file</td><td>application/x-7z-compressed</td></tr><tr><td>.aac</td><td>AAC audio</td><td>audio/aac</td></tr><tr><td>.avi</td><td>AVI video file</td><td>video/x-msvideo</td></tr><tr><td>.bmp</td><td>BMP image</td><td>image/bmp</td></tr><tr><td>.csv</td><td>Comma-separated values</td><td>text/csv</td></tr><tr><td>.doc</td><td>Microsoft Word document (97-2003)</td><td>application/msword</td></tr><tr><td>.docm</td><td>Microsoft Word macro-enabled document</td><td>application/vnd.ms-word.document.macroEnabled.12</td></tr><tr><td>.docx</td><td>Microsoft Word document (2007 or later)</td><td>application/vnd.openxmlformats-officedocument.wordprocessingml.document</td></tr><tr><td>.epub</td><td>EPUB e-book file</td><td>application/epub+zip</td></tr><tr><td>.gif</td><td>GIF image</td><td>image/gif</td></tr><tr><td>.gz</td><td>GZIP compressed file</td><td>application/gzip</td></tr><tr><td>.ico</td><td>Icon file</td><td>image/vnd.microsoft.icon</td></tr><tr><td>.ics</td><td>iCalendar file</td><td>text/calendar</td></tr><tr><td>.jpg, .jpeg</td><td>JPEG image</td><td>image/jpeg</td></tr><tr><td>.json</td><td>JSON data</td><td>application/json</td></tr><tr><td>.mid, .midi</td><td>MIDI audio file</td><td>audio/midi</td></tr><tr><td>.mp3</td><td>MP3 audio file</td><td>audio/mpeg</td></tr><tr><td>.mp4</td><td>MP4 video file</td><td>video/mp4</td></tr><tr><td>.mpeg</td><td>MPEG video file</td><td>video/mpeg</td></tr><tr><td>.oga</td><td>Ogg audio file</td><td>audio/ogg</td></tr><tr><td>.ogv</td><td>Ogg video file</td><td>video/ogg</td></tr><tr><td>.ogx</td><td>Ogg file</td><td>application/ogg</td></tr><tr><td>.one</td><td>Microsoft OneNote file</td><td>application/onenote</td></tr><tr><td>.opus</td><td>Opus audio file</td><td>audio/opus</td></tr><tr><td>.otf</td><td>OpenType font</td><td>font/otf</td></tr><tr><td>.pdf</td><td>PDF document</td><td>application/pdf</td></tr><tr><td>.png</td><td>PNG image</td><td>image/png</td></tr><tr><td>.ppsm</td><td>PowerPoint macro-enabled slideshow</td><td>application/vnd.ms-powerpoint.slideshow.macroEnabled.12</td></tr><tr><td>.ppsx</td><td>PowerPoint slideshow</td><td>application/vnd.openxmlformats-officedocument.presentationml.slideshow</td></tr><tr><td>.ppt</td><td>PowerPoint presentation (97-2003)</td><td>application/vnd.ms-powerpoint</td></tr><tr><td>.pptm</td><td>PowerPoint macro-enabled presentation</td><td>application/vnd.ms-powerpoint.presentation.macroEnabled.12</td></tr><tr><td>.pptx</td><td>PowerPoint presentation (2007 or later)</td><td>application/vnd.openxmlformats-officedocument.presentationml.presentation</td></tr><tr><td>.pub</td><td>Microsoft Publisher document</td><td>application/vnd.ms-publisher</td></tr><tr><td>.rar</td><td>RAR compressed file</td><td>application/x-rar-compressed</td></tr><tr><td>.rpmsg</td><td>Outlook email message</td><td>application/vnd.ms-outlook</td></tr><tr><td>.rtf</td><td>Rich Text Format document</td><td>application/rtf</td></tr><tr><td>.svg</td><td>Scalable Vector Graphics image</td><td>image/svg+xml</td></tr><tr><td>.tar</td><td>Tar archive file</td><td>application/x-tar</td></tr><tr><td>.tif, .tiff</td><td>Tagged Image File Format</td><td>image/tiff</td></tr><tr><td>.ttf</td><td>TrueType font</td><td>font/ttf</td></tr><tr><td>.txt</td><td>Text document</td><td>text/plain</td></tr><tr><td>.vsd</td><td>Microsoft Visio drawing</td><td>application/vnd.visio</td></tr><tr><td>.wav</td><td>Waveform Audio File Format</td><td>audio/wav</td></tr><tr><td>.weba</td><td>WebM audio file</td><td>audio/webm</td></tr><tr><td>.webm</td><td>WebM video file</td><td>video/webm</td></tr><tr><td>.webp</td><td>WebP image file</td><td>image/webp</td></tr><tr><td>.wma</td><td>Windows Media Audio file</td><td>audio/x-ms-wma</td></tr><tr><td>.wmv</td><td>Windows Media Video file</td><td>video/x-ms-wmv</td></tr><tr><td>.woff</td><td>Web Open Font Format</td><td>font/woff</td></tr><tr><td>.woff2</td><td>Web Open Font Format 2.0</td><td>font/woff2</td></tr><tr><td>.xls</td><td>Microsoft Excel spreadsheet (97-2003)</td><td>application/vnd.ms-excel</td></tr><tr><td>.xlsm</td><td>Microsoft Excel macro-enabled spreadsheet</td><td>application/vnd.ms-excel.sheet.macroEnabled.12</td></tr><tr><td>.xlsx</td><td>Microsoft Excel spreadsheet (Open XML)</td><td>application/vnd.openxmlformats-officedocument.spreadsheetml.sheet</td></tr><tr><td>.xml</td><td>Extensible Markup Language file</td><td>application/xml</td></tr><tr><td>.log</td><td>Log file</td><td>text/plain</td></tr><tr><td>.zip</td><td>zip file</td><td>application/zip</td></tr></tbody></table>


# Add Formula Column

PowerTable has a built-in formula engine that can perform calculations on your data. Formula columns are calculated columns created from your data that enable you to derive business-specific metrics or calculations on the go. You can add them at the visual level or directly to your source database.

1. To insert formula columns, go to **Setup > Columns.**

<figure><img src="https://1781349671-files.gitbook.io/~/files/v0/b/gitbook-x-prod.appspot.com/o/spaces%2FKyXRCFh0c08ryiUFvyMV%2Fuploads%2FA6YxIAqb1N2YBAztLXWr%2Fimage.png?alt=media&amp;token=1f4af3ea-7fde-4d41-9fe2-c8d6c992491e" alt=""><figcaption><p>Setup > Columns</p></figcaption></figure>

2. Select **Add Visual Column > Add Formula Column.**

<figure><img src="https://1781349671-files.gitbook.io/~/files/v0/b/gitbook-x-prod.appspot.com/o/spaces%2FKyXRCFh0c08ryiUFvyMV%2Fuploads%2Ft8APCLX6FGeM92Wq4shL%2Fimage.png?alt=media&amp;token=f218c84c-1dbd-47dd-97ba-72ecd9b9f5c0" alt=""><figcaption><p>Add Formula Column</p></figcaption></figure>

You can also insert a formula column as shown below:

<figure><img src="https://1781349671-files.gitbook.io/~/files/v0/b/gitbook-x-prod.appspot.com/o/spaces%2FKyXRCFh0c08ryiUFvyMV%2Fuploads%2FAiBa3OBjHFDEYxhXOJEs%2Fimage.png?alt=media&amp;token=4e26a5e5-b0e8-4e28-a46a-0cf4f30c47f5" alt=""><figcaption></figcaption></figure>

3. Configure the formula column by entering the column name and required formula, then click **Save**.

<figure><img src="https://1781349671-files.gitbook.io/~/files/v0/b/gitbook-x-prod.appspot.com/o/spaces%2FKyXRCFh0c08ryiUFvyMV%2Fuploads%2FHwuaQTG4Gl2ReD2Vzrp4%2Fimage.png?alt=media&amp;token=486e3d9b-c06c-4ad2-a5ba-acc1275210d1" alt=""><figcaption><p>Configuring a formula column</p></figcaption></figure>

* You can create a formula column directly in the database by selecting the checkbox labeled "**Create a database column**."
* Select the appropriate data type for the column. The formula column will be added to the source database.

<figure><img src="https://1781349671-files.gitbook.io/~/files/v0/b/gitbook-x-prod.appspot.com/o/spaces%2FKyXRCFh0c08ryiUFvyMV%2Fuploads%2F1dQjbnszXoN47N0CBLn2%2Fimage.png?alt=media&amp;token=076c6c6b-8e44-4696-806f-3915b73ec175" alt=""><figcaption><p>Creating a formula column in the database</p></figcaption></figure>

The formula column has now been added successfully.

<figure><img src="https://1781349671-files.gitbook.io/~/files/v0/b/gitbook-x-prod.appspot.com/o/spaces%2FKyXRCFh0c08ryiUFvyMV%2Fuploads%2FNJ9XSR23LIS0tpbISVoi%2Fimage.png?alt=media&amp;token=40dda4ed-ce06-440c-976e-afa7f7211367" alt=""><figcaption><p>Formula column added</p></figcaption></figure>

Formula columns cannot be edited directly because their values are based on an underlying formula.&#x20;

For more information about formulas and functions, you can refer to [this section.](/explore-powertable/formulas-and-functions)


# Add Database Column

PowerTable lets users add new columns to the source database directly through the app. This feature eliminates the need for users to engage with the database directly, enhancing security and efficiency.

{% hint style="info" %}
Please ensure you have the required permissions to the database you are connected to, as you are adding a column directly to the source database.
{% endhint %}

Let us consider the example below where we will add the approver details column to the 'Product SubCategories' table.

1. To add a new column to the source, click on **Add Database Column.**

<figure><img src="https://1781349671-files.gitbook.io/~/files/v0/b/gitbook-x-prod.appspot.com/o/spaces%2FKyXRCFh0c08ryiUFvyMV%2Fuploads%2FVMnpmzQtEAVcCiQa1mjv%2Fimage.png?alt=media&amp;token=9bc88c6d-e80a-40d0-88e9-7f73f042a241" alt=""><figcaption><p>Add Database Column</p></figcaption></figure>

2. Enter the column name and its data type. You can optionally make it a non-nullable column and assign a default value. Then click **Save.**

Here, we have added the 'Approvers' column with the data type VARCHAR.

<figure><img src="https://1781349671-files.gitbook.io/~/files/v0/b/gitbook-x-prod.appspot.com/o/spaces%2FKyXRCFh0c08ryiUFvyMV%2Fuploads%2FSgQab4hjDfuqYyHFkFBY%2Fimage.png?alt=media&amp;token=bfe81497-22f6-4195-9a2b-463777f8f93b" alt=""><figcaption><p>Add column name and data type</p></figcaption></figure>

3. Configure the column properties for the newly added column, as you would for any other columns, and then click **Save**.

<figure><img src="https://1781349671-files.gitbook.io/~/files/v0/b/gitbook-x-prod.appspot.com/o/spaces%2FKyXRCFh0c08ryiUFvyMV%2Fuploads%2FxtMEykvd039Tj8QsdqlW%2Fimage.png?alt=media&amp;token=8b4efe3b-8a0a-4cfe-a476-1d5074a4d449" alt=""><figcaption><p>Configuring the added column</p></figcaption></figure>

4. Now you can view the newly added column in the app, where you can start updating the details. The newly added column as well as the changes are synced with the source database.

<figure><img src="https://1781349671-files.gitbook.io/~/files/v0/b/gitbook-x-prod.appspot.com/o/spaces%2FKyXRCFh0c08ryiUFvyMV%2Fuploads%2Ff4Zb6GOXoJzgheyEfqoG%2Fimage.png?alt=media&amp;token=09447f20-9aea-4434-b98e-805f0e05fdd1" alt=""><figcaption><p>Update details </p></figcaption></figure>

{% hint style="warning" %}
Please exercise caution when adding columns. Once created, they cannot be modified or deleted from the app directly—you must access the database to do so.
{% endhint %}


# Configure Column Properties

Configuring column properties ensures that your data is accurate and consistent in the database. Setting the right data types, constraints, and relationships prevents errors and improves data integrity. It keeps the database manageable and scalable, making future updates easier.

## 1. Column set up in PowerTable

After loading your data into PowerTable, you can configure the column properties in the **Columns** section.&#x20;

The column properties include the input type, whether the column is editable or not, its default value, minimum and maximum values (constraints), lookup and relation, prefix, suffix, etc.

* While importing CSV data or creating a database from scratch, you will be allowed to configure these properties during the initial steps.&#x20;
* When connecting to a database, PowerTable automatically detects and configures the input type and other basic settings. You can either retain them or change them as needed to meet specific business requirements.

You can modify the column properties at any time by selecting **Setup > Columns**.

<figure><img src="https://1781349671-files.gitbook.io/~/files/v0/b/gitbook-x-prod.appspot.com/o/spaces%2FKyXRCFh0c08ryiUFvyMV%2Fuploads%2F6OYvn68yqeVsDyD0kkrL%2Fimage.png?alt=media&amp;token=9cbb777a-7d28-408e-bad6-16bb6fbdaa37" alt=""><figcaption><p>Setup columns</p></figcaption></figure>

You can also click on **Manage Columns > Edit Config** to configure the column properties.

<figure><img src="https://1781349671-files.gitbook.io/~/files/v0/b/gitbook-x-prod.appspot.com/o/spaces%2FKyXRCFh0c08ryiUFvyMV%2Fuploads%2FUmqhp1f8cpgTMADYLBU1%2Fimage.png?alt=media&amp;token=b7834d65-e618-479b-9805-e91c9f08a41c" alt=""><figcaption><p>Edit column properties</p></figcaption></figure>

This opens the column setup window, as shown below.

<figure><img src="https://1781349671-files.gitbook.io/~/files/v0/b/gitbook-x-prod.appspot.com/o/spaces%2FKyXRCFh0c08ryiUFvyMV%2Fuploads%2FKsHL3BThoIXjj9ntq0Kv%2Fimage.png?alt=media&amp;token=30d545ea-f733-41b4-81a9-7989c4efcb77" alt=""><figcaption><p>Columns setup</p></figcaption></figure>

## 2. Display

The 'Display' field allows you to display or hide a column from the table. You can clear this box to hide a specific column. This option can be useful when certain data does not need to be displayed but should remain in the table.

<figure><img src="https://1781349671-files.gitbook.io/~/files/v0/b/gitbook-x-prod.appspot.com/o/spaces%2FKyXRCFh0c08ryiUFvyMV%2Fuploads%2FXtTiao05fdKwW3EomtDv%2Fimage.png?alt=media&amp;token=038d1688-c9d5-44bb-a3cf-8a5691de3418" alt=""><figcaption><p>Display</p></figcaption></figure>

{% hint style="info" %}
To adjust the width of columns, click and drag the column headers manually or configure them from the [**Manage Columns**](/explore-powertable/working-with-powertable/column-setup/change-column-widths) menu.
{% endhint %}

## 3. Required

This field specifies whether the user must enter the values in the column or if they can be left blank. Checking this box makes the column mandatory. You can specify which columns are required.

Typically, primary keys and business keys are considered required columns.

<figure><img src="https://1781349671-files.gitbook.io/~/files/v0/b/gitbook-x-prod.appspot.com/o/spaces%2FKyXRCFh0c08ryiUFvyMV%2Fuploads%2F4Ng1T1QBoKMQBh08kGsu%2Fimage.png?alt=media&amp;token=7ddd86fd-879d-46ae-8bb6-435327a37941" alt=""><figcaption><p>Required</p></figcaption></figure>

## 4. Configuring Column Properties

To edit a column's properties, click the pencil icon next to it or double-click the column name.&#x20;

<figure><img src="https://1781349671-files.gitbook.io/~/files/v0/b/gitbook-x-prod.appspot.com/o/spaces%2FKyXRCFh0c08ryiUFvyMV%2Fuploads%2FxXQDPyCii0Qk7ECaTv62%2Fimage.png?alt=media&amp;token=f98ae52c-9578-462b-8e5a-fcb81fa775be" alt=""><figcaption><p>Edit column properties</p></figcaption></figure>

The column properties are broadly classified into [**General**](/explore-powertable/working-with-powertable/column-setup/configure-column-properties/general) and [**Display**](/explore-powertable/working-with-powertable/column-setup/configure-column-properties/display) properties.

* Configuring general properties includes defining the **column's input type, constraints, and default value.**
* Display properties include a **column's display name and its description**. For number-type columns, you can also configure the required **prefix, suffix, and thousand separator**.

We will explain each of the above in the upcoming sections.


# General

In this category, you can define the following properties:

1. [Type](#id-1.-type)
2. [Constraints](#id-2.-constraints) and
3. [Default Value](#id-3.-default-value)

## **1. Type**

Specify the input data type to be allowed in each column using this dropdown.

<figure><img src="https://1781349671-files.gitbook.io/~/files/v0/b/gitbook-x-prod.appspot.com/o/spaces%2FKyXRCFh0c08ryiUFvyMV%2Fuploads%2FggmA2VjJhnnqmKNqiBYi%2Fimage.png?alt=media&amp;token=d88f81d8-d96b-4aad-9001-f9016a35afc1" alt=""><figcaption><p>Column Type</p></figcaption></figure>

PowerTable allows the following data types as inputs:

* Number
* Decimal
* Text
* Date Time
* Date
* Single Select
* Check Box
* Image
* Person
* URL
* Email

Further, you can configure additional properties based on the selected input type.&#x20;

Example: For number-type input, you can set the minimum and maximum allowed values. For single-select type, you can either manually configure the dropdown values or fetch them from a lookup table. These properties are explained in the next sections.

## **2. Constraints**

This section provides options for limiting input values and configuring field validation.

### **2.1. Minimum and Maximum**

Here you can specify the minimum and maximum values that can be entered into the columns. Any values outside of this range are not permitted. These limits can be applied to the input types: *Number, Decimal, Date Time,* and *Date*.

Consider the example below, where the minimum and maximum values are set for the ***Product Cost*** column.

<figure><img src="https://1781349671-files.gitbook.io/~/files/v0/b/gitbook-x-prod.appspot.com/o/spaces%2FKyXRCFh0c08ryiUFvyMV%2Fuploads%2FlHTUIrQrksiSYZQ0JROc%2Fimage.png?alt=media&amp;token=189b9c1c-61f5-47ea-8c31-3a308b7a9dff" alt=""><figcaption><p>Minimum and Maximum</p></figcaption></figure>

The existing values remain unchanged. However, if a user enters a value that falls outside the specified range, they will be notified of the minimum and maximum limits.

<figure><img src="https://1781349671-files.gitbook.io/~/files/v0/b/gitbook-x-prod.appspot.com/o/spaces%2FKyXRCFh0c08ryiUFvyMV%2Fuploads%2FqdKiuNfrSD37oWBNr2at%2Fimage.png?alt=media&amp;token=69090427-1a94-4c50-945a-9873dce3fcbe" alt=""><figcaption><p>user notified about the min and max values </p></figcaption></figure>

**Note:** You can also set only one of these limits (minimum or maximum) and not both.

For the 'Date' and 'Date Time' input types, users may choose a date range or both date and time range. Any date or time outside of this range will not be accepted.

<figure><img src="https://1781349671-files.gitbook.io/~/files/v0/b/gitbook-x-prod.appspot.com/o/spaces%2FKyXRCFh0c08ryiUFvyMV%2Fuploads%2FrUvIP5Vj45Lm9r1TV2NO%2Fimage.png?alt=media&amp;token=913ada65-7f26-4662-a002-7f5911f0af28" alt=""><figcaption><p>Minimum and maximum date range</p></figcaption></figure>

### **2.2. Field Validation**

This option is available for the text input type and allows you to specify which types of inputs can be entered into a column. This way, you can ensure that the data is correct and accurate.

You can allow users to enter any value or only numeric, alphanumeric, non-numeric, email, URL, or regex-matching inputs.&#x20;

<figure><img src="https://1781349671-files.gitbook.io/~/files/v0/b/gitbook-x-prod.appspot.com/o/spaces%2FKyXRCFh0c08ryiUFvyMV%2Fuploads%2FhtC9hXzuljTCblt2oFq9%2Fimage.png?alt=media&amp;token=ba97fd18-5640-499a-8998-64fc3754ee76" alt=""><figcaption><p>Field Validation</p></figcaption></figure>

With Regex, you can specify a pattern and allow only matching inputs. In the example below, we have entered the regex pattern against which the user input will be validated.&#x20;

<figure><img src="https://1781349671-files.gitbook.io/~/files/v0/b/gitbook-x-prod.appspot.com/o/spaces%2FKyXRCFh0c08ryiUFvyMV%2Fuploads%2FrUvOjTwcHuaTNoOSKS26%2Fimage.png?alt=media&amp;token=8fbe776a-9ee6-469a-a76d-31fe4938e2e0" alt=""><figcaption><p>field validation with regex</p></figcaption></figure>

The entered value is validated against the specified input type configuration. Inputs that do not match the pattern are identified and rejected.

<figure><img src="https://1781349671-files.gitbook.io/~/files/v0/b/gitbook-x-prod.appspot.com/o/spaces%2FKyXRCFh0c08ryiUFvyMV%2Fuploads%2FQmy57T0CakyjNWwfdJAO%2Fimage.png?alt=media&amp;token=31fe1374-a6b9-43fd-a168-6142fd5a015f" alt=""><figcaption></figcaption></figure>

## 3. Default Value

PowerTable lets you configure default values for the columns. When a new row is added, the specified column is automatically filled with the default value if you have set one.

### 3.1. Manual value

To set a static value, select **Manual** and enter the value.

In the example below, we have added 'NA' as the default value for the 'Product Description' column.

<figure><img src="https://1781349671-files.gitbook.io/~/files/v0/b/gitbook-x-prod.appspot.com/o/spaces%2FKyXRCFh0c08ryiUFvyMV%2Fuploads%2FlNPma5aOdZyhMqGQTMRs%2Fimage.png?alt=media&amp;token=508efa00-e5c8-4933-a669-26418a244888" alt=""><figcaption><p>Setting a static default value</p></figcaption></figure>

Whenever a new row is added, this column value is automatically populated with 'NA' by default, which can be modified later.

<figure><img src="https://1781349671-files.gitbook.io/~/files/v0/b/gitbook-x-prod.appspot.com/o/spaces%2FKyXRCFh0c08ryiUFvyMV%2Fuploads%2Fn9nOAUe5ctg2FecwqNIz%2Fimage.png?alt=media&amp;token=55d073bb-6e15-493d-8a95-38b69a515ee3" alt=""><figcaption><p>Default value is filled automatically</p></figcaption></figure>

#### Reset to default on update

Checking the 'Reset to default on update' option not only sets the default value for the column but also disables the column from editing. The existing values are retained, but they are automatically changed to the default value only when users edit other values in the specific record.

Find below an example where the existing value changes to the default value after an update.

<figure><img src="https://1781349671-files.gitbook.io/~/files/v0/b/gitbook-x-prod.appspot.com/o/spaces%2FKyXRCFh0c08ryiUFvyMV%2Fuploads%2FYLG25cLkyNBDcxFVEm56%2FresettodefaultPowerTab.gif?alt=media&amp;token=ca363872-44ef-4e9e-b9c1-d9a46727adaf" alt=""><figcaption><p>Reset to default on update</p></figcaption></figure>

* For the 'Decimal' input type, you can specify the default number of decimal digits to be allowed.

<figure><img src="https://1781349671-files.gitbook.io/~/files/v0/b/gitbook-x-prod.appspot.com/o/spaces%2FKyXRCFh0c08ryiUFvyMV%2Fuploads%2FBALMvlMbP4oyuBA01y3W%2Fimage.png?alt=media&amp;token=6d1924ce-b39b-4b86-b972-a1a1a760df25" alt=""><figcaption><p>Configuring number of decimal points</p></figcaption></figure>

* For the 'Person' input type, you can either use their name or email address as default.
* For the 'Single-select' type, you can choose the default value from the list of options you have configured.

<figure><img src="https://1781349671-files.gitbook.io/~/files/v0/b/gitbook-x-prod.appspot.com/o/spaces%2FKyXRCFh0c08ryiUFvyMV%2Fuploads%2FYejpV1Ii4sTrbeL7GVXA%2Fimage.png?alt=media&amp;token=8c36b648-88a4-41f0-a66f-45665ac87ea1" alt=""><figcaption><p>Configuring default value for single-select type</p></figcaption></figure>

* For the 'Check Box' type, the default values are automatically configured with the Boolean values: true and false. You can change these to 1 and 0 or yes and no, etc., if necessary.

<figure><img src="https://1781349671-files.gitbook.io/~/files/v0/b/gitbook-x-prod.appspot.com/o/spaces%2FKyXRCFh0c08ryiUFvyMV%2Fuploads%2FkuUX2LJAHQEGKTw62lWH%2Fimage.png?alt=media&amp;token=65d88d9f-eff0-45b1-b9f6-dff9eb260b3a" alt=""><figcaption><p>Configuring default value for checkbox type</p></figcaption></figure>

### 3.2. Derived value

You can set derived values as defaults instead of using static values. These derived values are calculated using configurable formulas.&#x20;

PowerTable provides many Excel-like formulas and functions to help you perform these calculations. These values change dynamically as the underlying reference data changes.

Derived values can be set for the field types - **Number, Decimal, Text, Date, Date Time, Person, and Email.**

#### Recalculate data on update

Checking the 'Recalculate data on update' option sets the calculated value as default for newly inserted rows and also disables the column from editing. The existing values are retained, and they are automatically changed to the derived value only when users edit other values in the specific record.&#x20;

We have discussed setting the type, constraints, and defaults for table data. In the next section, we will explore how to select and look up values from a table or visual for a single-select field type.


# Lookup and Relation

PowerTable allows you to configure any field in the table using the single-select input type. The lookup and relation field is specifically designed for setting up single-select type columns.\
\
In addition to manually configuring the dropdown options, PowerTable offers additional methods for sourcing values from dimensions, even if they reside in a different table or data source, through the use of lookup tables.&#x20;

In summary, we have the following methods to configure the options:

1. [Manual:](#id-1.-manual) Configure the dropdown options manually.
2. [Distinct Values:](#id-2.-distinct-values) Use the existing values in the column as a drop-down list with distinct options.
3. [Lookup Table:](#id-3.-lookup-table) Source values from another table in a database, which is usually done for foreign key fields.

This section will provide a detailed procedure for configuring dropdown values for each method.

## 1. Manual

This method allows you to type in the drop-down options and labels manually.&#x20;

Let us take an example where the ***Product Color*** column options are set manually:

<figure><img src="https://1781349671-files.gitbook.io/~/files/v0/b/gitbook-x-prod.appspot.com/o/spaces%2FKyXRCFh0c08ryiUFvyMV%2Fuploads%2Fgqj8ANDW510SUSP94tZ1%2Fimage.png?alt=media&amp;token=d75aa5b3-509a-49cb-a060-9d281c214849" alt=""><figcaption><p>Adding options manually</p></figcaption></figure>

1. Click on the pencil icon beside the ProductColor field.
2. Choose **Single Select** and then **Manual** in the Type fields.
3. Enter the options and labels as required.
4. Click **Save** to save the configuration.
5. Click **Add** to add new options and the bin icon to delete an option.

<figure><img src="https://1781349671-files.gitbook.io/~/files/v0/b/gitbook-x-prod.appspot.com/o/spaces%2FKyXRCFh0c08ryiUFvyMV%2Fuploads%2FFUzf4JSGNvtIQ0R52FSm%2Fimage.png?alt=media&amp;token=ec377f71-2504-4912-a810-ca22ce429bac" alt=""><figcaption><p>Other options</p></figcaption></figure>

You can now edit the table with the added dropdown options. PowerTable differentiates the single-select options by using different text-fill colors.

<figure><img src="https://1781349671-files.gitbook.io/~/files/v0/b/gitbook-x-prod.appspot.com/o/spaces%2FKyXRCFh0c08ryiUFvyMV%2Fuploads%2FLsAjVU88EIuudsKJz0FQ%2Fimage.png?alt=media&amp;token=022a11a7-cf16-422c-9c92-c70702456461" alt=""><figcaption><p>Selecting an option</p></figcaption></figure>

## 2. Distinct Values

When you select this option, PowerTable creates a distinct list of options from the existing values.

1. In the table below, the ***Product Name*** field already contains a list of product names.

<figure><img src="https://1781349671-files.gitbook.io/~/files/v0/b/gitbook-x-prod.appspot.com/o/spaces%2FKyXRCFh0c08ryiUFvyMV%2Fuploads%2F2fcRE5LkgRInPXnPPZuc%2Fimage.png?alt=media&amp;token=aa01af26-7c70-436b-b8d1-ec7fdb77e1f9" alt=""><figcaption><p>Existing values in the table</p></figcaption></figure>

2. When you choose Distinct, these values become the drop-down options. Click **Save.**

<figure><img src="https://1781349671-files.gitbook.io/~/files/v0/b/gitbook-x-prod.appspot.com/o/spaces%2FKyXRCFh0c08ryiUFvyMV%2Fuploads%2FIZLm7jQvDyEJCSXLBgiG%2Fimage.png?alt=media&amp;token=e7dd6b47-d265-4fd3-8ae5-fa094436a439" alt=""><figcaption><p>Distinct values</p></figcaption></figure>

You can now choose the product name from the list of distinct values that has been created. Notice how the column values are color-coded to indicate a single-select dropdown list.

<figure><img src="https://1781349671-files.gitbook.io/~/files/v0/b/gitbook-x-prod.appspot.com/o/spaces%2FKyXRCFh0c08ryiUFvyMV%2Fuploads%2FYcyV0jGGDv3DNJD3r3iG%2Fimage.png?alt=media&amp;token=3af4a146-a8c5-47d1-accc-3608ee2d9962" alt=""><figcaption><p>Selecting an option</p></figcaption></figure>

## 3. Lookup Table

PowerTable allows you to look up and source values from other tables as well.&#x20;

1. When you select 'Lookup,' the highlighted section appears, where you can enter the schema name, the lookup table, the current table column containing the keys, and the lookup table column from which the drop-down options should be sourced.&#x20;

<figure><img src="https://1781349671-files.gitbook.io/~/files/v0/b/gitbook-x-prod.appspot.com/o/spaces%2FKyXRCFh0c08ryiUFvyMV%2Fuploads%2FJIn20r0Uhy3yowzJ9i76%2Fimage.png?alt=media&amp;token=c64a6513-5067-40a4-b310-74fa51252dc5" alt=""><figcaption><p>Schema and lookup table details</p></figcaption></figure>

**Note:** If there are any common columns between the lookup table and the current table, you can also set up filter criteria based on those matching columns. Only drop-down values that meet the filter criteria will be displayed, ensuring accuracy and ease of option selection.

<figure><img src="https://1781349671-files.gitbook.io/~/files/v0/b/gitbook-x-prod.appspot.com/o/spaces%2FKyXRCFh0c08ryiUFvyMV%2Fuploads%2Fl0jnWMNZCsITdAHTEovu%2Fimage.png?alt=media&amp;token=410a0665-330c-4677-8861-e3ccb5d03066" alt=""><figcaption><p>Filter based on value in matching column</p></figcaption></figure>

2. Click **Save** to save the configuration.&#x20;

The existing sub-category keys are replaced with their corresponding sub-category names using lookup.

<figure><img src="https://1781349671-files.gitbook.io/~/files/v0/b/gitbook-x-prod.appspot.com/o/spaces%2FKyXRCFh0c08ryiUFvyMV%2Fuploads%2Fa9Ba4TLdtc1IVwVy1n3N%2Fimage.png?alt=media&amp;token=297cdf72-3049-40a2-8168-918a21ccdb71" alt=""><figcaption><p>lookup values</p></figcaption></figure>

For newly inserted rows, you can use the drop-down to select from these lookup values.&#x20;

In the next section, we will look at the display settings.


# Display

The Display section allows you to specify how the column header and their values should be displayed based on your needs.&#x20;

Go to **Setup > Columns.**&#x20;

<figure><img src="https://1781349671-files.gitbook.io/~/files/v0/b/gitbook-x-prod.appspot.com/o/spaces%2FKyXRCFh0c08ryiUFvyMV%2Fuploads%2FTJIMed3MTATDcBVth612%2Fimage.png?alt=media&amp;token=c41b8e41-124d-46e4-a0b7-5acacaaef4d1" alt=""><figcaption><p>Accessing the 'Columns' section</p></figcaption></figure>

Click on the pencil icon beside the column name or double-click on the column name. Go to the **Display** tab.

<figure><img src="https://1781349671-files.gitbook.io/~/files/v0/b/gitbook-x-prod.appspot.com/o/spaces%2FKyXRCFh0c08ryiUFvyMV%2Fuploads%2FSk3w3rlbwyNUFF5V2LFG%2Fimage.png?alt=media&amp;token=5f842d8d-4f10-4d53-a7ca-700eb3b66e6a" alt=""><figcaption><p>Display properties</p></figcaption></figure>

Here, you can add and configure various display properties, such as the date format, display name, thousand separator, prefix, and suffix.&#x20;

## 1. Format

Using the Format property, you can define how the date and date-time values should be presented in the columns. You can choose from various date and date-time formats such as 'MM/DD/YYYY', 'DD/MM/YYYY', 'DD MMM, YYYY hh:mm:ss', and so on.

<figure><img src="https://1781349671-files.gitbook.io/~/files/v0/b/gitbook-x-prod.appspot.com/o/spaces%2FKyXRCFh0c08ryiUFvyMV%2Fuploads%2F9tL3ZfnBIleuHt3LVqxB%2Fimage.png?alt=media&amp;token=e94da4c6-f164-4852-bc02-ae6caeaa66d3" alt=""><figcaption><p>Date format</p></figcaption></figure>

## **2. Display Name**

The Display Name property enables you to display a user-friendly name for the column header, different from the actual field name in the database. For instance, the 'ProductSubcategoryKey' field in the database can be displayed as 'Product SubCategory' in the visual for enhanced clarity.

<figure><img src="https://1781349671-files.gitbook.io/~/files/v0/b/gitbook-x-prod.appspot.com/o/spaces%2FKyXRCFh0c08ryiUFvyMV%2Fuploads%2F8lowCUOnAGMZ1dPUcVfv%2Fimage.png?alt=media&amp;token=81a68e9a-abf5-4683-a92f-381ac5a1e872" alt=""><figcaption><p>Display Name</p></figcaption></figure>

## **3. Description**

You can use the 'Description' field to include additional information in the column headers, helping users understand the data better. An 'i' icon is added beside the header name, and when you hover over it, the additional description is shown.

<figure><img src="https://1781349671-files.gitbook.io/~/files/v0/b/gitbook-x-prod.appspot.com/o/spaces%2FKyXRCFh0c08ryiUFvyMV%2Fuploads%2FSbiBtqduZF5PugpyTBHK%2Fimage.png?alt=media&amp;token=51a62517-3348-426d-b456-2c36dc4c6d95" alt=""><figcaption><p>Description</p></figcaption></figure>

## **4. Thousand Separator**&#x20;

By default, numbers in the column are displayed continuously without any thousand separators. To enhance the readability of large numeric values, you can add a comma, a period, or a space as a separator for every group of thousands.

<figure><img src="https://1781349671-files.gitbook.io/~/files/v0/b/gitbook-x-prod.appspot.com/o/spaces%2FKyXRCFh0c08ryiUFvyMV%2Fuploads%2FSwZy1pt4f13w9vws9q64%2Fimage.png?alt=media&amp;token=2c292024-26ef-46c3-969c-a089a37afdc1" alt=""><figcaption><p>Thousand separator</p></figcaption></figure>

## **5. Prefix**

This property allows you to add a prefix of up to two characters before numeric or decimal column values. This is commonly used to indicate currency symbols.

<figure><img src="https://1781349671-files.gitbook.io/~/files/v0/b/gitbook-x-prod.appspot.com/o/spaces%2FKyXRCFh0c08ryiUFvyMV%2Fuploads%2FZnoL3xjRCLUfDkgkT4vp%2Fimage.png?alt=media&amp;token=9ae081e8-b677-49cf-b6ab-10b2bac5e451" alt=""><figcaption><p>Prefix</p></figcaption></figure>

## **6. Suffix**

This property lets you add a suffix of up to two characters after numeric or decimal column values. This can be used to indicate measurement units like kilograms, centimeters, and percentages.

We have now discussed all the column properties that can be configured from the **Columns** section. In the next section, we will look at other options, such as importing/exporting configurations and adding columns.


# Manage Columns

We provide a dedicated menu to manage all column properties, such as column width, visibility, column input type configurations, and access control.

To change any of the column attributes listed above, click on **Manage Columns**.

<figure><img src="https://1781349671-files.gitbook.io/~/files/v0/b/gitbook-x-prod.appspot.com/o/spaces%2FKyXRCFh0c08ryiUFvyMV%2Fuploads%2F1cd6yPeGHzjaiJc5QuOH%2Fimage.png?alt=media&amp;token=57fe2024-8b20-4ed6-90c9-6f7e9e162233" alt=""><figcaption><p>Manage Columns</p></figcaption></figure>

## 1. Adjust Column Width

You can specify the width of each column in pixels.&#x20;

Enter the column width in pixels for the columns that you want to adjust.

<figure><img src="https://1781349671-files.gitbook.io/~/files/v0/b/gitbook-x-prod.appspot.com/o/spaces%2FKyXRCFh0c08ryiUFvyMV%2Fuploads%2FZBKm3ts5W30jCV10QCTL%2Fimage.png?alt=media&amp;token=b9cb0840-eb50-45a6-900f-592b300018b3" alt=""><figcaption><p>Adjust column width</p></figcaption></figure>

You can use the **Reset** option to restore the column widths to their original values before any changes were made.

<figure><img src="https://1781349671-files.gitbook.io/~/files/v0/b/gitbook-x-prod.appspot.com/o/spaces%2FKyXRCFh0c08ryiUFvyMV%2Fuploads%2FUOmXAg0qs7kXOv3HTU8V%2Fimage.png?alt=media&amp;token=3162e989-eac7-4df3-a6d6-4bf8bd838df9" alt=""><figcaption><p>Reset to initial values</p></figcaption></figure>

## 2. Display/Hide Columns

To display or hide specific columns, check or uncheck the checkbox beside them. In the example below, we have hidden the 'Product Description' column.

<figure><img src="https://1781349671-files.gitbook.io/~/files/v0/b/gitbook-x-prod.appspot.com/o/spaces%2FKyXRCFh0c08ryiUFvyMV%2Fuploads%2F0mDSOzN2qKSYO8GDzScD%2Fimage.png?alt=media&amp;token=10af8b89-0e5b-4c00-be6a-3f39944e8c36" alt=""><figcaption><p>Show or hide columns</p></figcaption></figure>

Enable the checkbox in the header to display all columns in the table.

<figure><img src="https://1781349671-files.gitbook.io/~/files/v0/b/gitbook-x-prod.appspot.com/o/spaces%2FKyXRCFh0c08ryiUFvyMV%2Fuploads%2Fiomsl8OszlwSKc3ogYSX%2Fimage.png?alt=media&amp;token=a4a80a9d-c1df-4749-b695-8bc7b323db1a" alt=""><figcaption><p>Display all columns</p></figcaption></figure>

## 3. Column Configuration

Click on **Edit Config** to open the column configuration window where you can configure all of the column properties.&#x20;

<figure><img src="https://1781349671-files.gitbook.io/~/files/v0/b/gitbook-x-prod.appspot.com/o/spaces%2FKyXRCFh0c08ryiUFvyMV%2Fuploads%2FtscQxaAIvS1rCMHc6ti3%2Fimage.png?alt=media&amp;token=4406e93a-4da8-48b2-95b8-97eb59563fde" alt=""><figcaption><p>Edit column configuration</p></figcaption></figure>

This opens the window as shown below. Refer to [this section](/explore-powertable/working-with-powertable/column-setup/configure-column-properties) to know more.

<figure><img src="https://1781349671-files.gitbook.io/~/files/v0/b/gitbook-x-prod.appspot.com/o/spaces%2FKyXRCFh0c08ryiUFvyMV%2Fuploads%2F47XeOskiakBphN408aIK%2Fimage.png?alt=media&amp;token=adf744b0-e31c-4858-a3c3-04c52bf81b43" alt=""><figcaption><p>Column Configuration window</p></figcaption></figure>

## 4. Column Access Control

Clicking on the **Column Access** option allows you to specify who can access which columns.

<figure><img src="https://1781349671-files.gitbook.io/~/files/v0/b/gitbook-x-prod.appspot.com/o/spaces%2FKyXRCFh0c08ryiUFvyMV%2Fuploads%2FTRaAKC6H7fG36NLHZIno%2Fimage.png?alt=media&amp;token=8ac71409-b4cf-4fe0-abf3-c0cc0f78ba31" alt=""><figcaption><p>Click on 'Column Access'</p></figcaption></figure>

The following window opens where you can configure the column access control. To know more, refer to [this section](/explore-powertable/access-control/column-permissions).

<figure><img src="https://1781349671-files.gitbook.io/~/files/v0/b/gitbook-x-prod.appspot.com/o/spaces%2FKyXRCFh0c08ryiUFvyMV%2Fuploads%2FiK154RcSVRvAmLXorngJ%2Fimage.png?alt=media&amp;token=8ccf210c-26cc-4b75-880f-567ee038793e" alt=""><figcaption><p>Column Access Control</p></figcaption></figure>

## 5. Re-order Columns

To rearrange columns, simply drag and drop the desired columns onto the table, or you can arrange the column headers here, as shown below.

<figure><img src="https://1781349671-files.gitbook.io/~/files/v0/b/gitbook-x-prod.appspot.com/o/spaces%2FKyXRCFh0c08ryiUFvyMV%2Fuploads%2FJDNxNwlVlHK05Xe3jvEi%2Fimage.png?alt=media&amp;token=152ee07c-7733-42f1-bfc3-4f3a59dd1974" alt=""><figcaption><p>Re-arrange columns</p></figcaption></figure>

#### Search and Filter

You can use the search bar to find and customize specific columns here, especially if there are many columns in the table. You can also filter specific columns by data type or column type.

<figure><img src="https://1781349671-files.gitbook.io/~/files/v0/b/gitbook-x-prod.appspot.com/o/spaces%2FKyXRCFh0c08ryiUFvyMV%2Fuploads%2F4ZZvxSfziWHwgud4tkaE%2Fimage.png?alt=media&amp;token=183c1ae0-4c64-4691-998d-baacd5ca0fd2" alt=""><figcaption><p>Search for columns</p></figcaption></figure>

<figure><img src="https://1781349671-files.gitbook.io/~/files/v0/b/gitbook-x-prod.appspot.com/o/spaces%2FKyXRCFh0c08ryiUFvyMV%2Fuploads%2FlP3xHotX7bjQqMMhgzbF%2Fimage.png?alt=media&amp;token=f8a8d3ff-afe0-4921-a3f7-3349757b06ea" alt=""><figcaption><p>Filter columns by data and column type</p></figcaption></figure>


# Change Column Widths

There are several ways to quickly change the width of columns, particularly when your table has a large number of columns.

The simplest way is to hover over the column header that needs to be resized and drag the handle to the desired size.

<figure><img src="https://1781349671-files.gitbook.io/~/files/v0/b/gitbook-x-prod.appspot.com/o/spaces%2FKyXRCFh0c08ryiUFvyMV%2Fuploads%2Ft9UljVT2bHdI3AQK1Xlv%2Fimage.png?alt=media&amp;token=8f8a2c6c-c154-4708-83d4-1d01c8620c1d" alt=""><figcaption><p>Drag column headers to resize</p></figcaption></figure>

There are other preset and manual column width adjustment options available from the toolbar.

1. ‘Fit to header’ resizes the columns to fit the column header.
2. ‘Fit to content’ resizes the columns to fit the column contents.
3. The 'Manage Columns' menu allows you to manually specify the width for all columns in pixels.

Let's explore each of them with an example.

In the 'Home' tab, click on the 'Auto fit' icon as highlighted. You can see the options in the dropdown.

<figure><img src="https://1781349671-files.gitbook.io/~/files/v0/b/gitbook-x-prod.appspot.com/o/spaces%2FKyXRCFh0c08ryiUFvyMV%2Fuploads%2FJO01uteNRMa2J4oE5TrA%2Fimage.png?alt=media&amp;token=51602539-746b-40af-a582-2e91f58c80d9" alt=""><figcaption><p>Autofit options</p></figcaption></figure>

## 1. Fit to Header <a href="#id-1.-fit-to-header" id="id-1.-fit-to-header"></a>

Clicking on the **Fit to Header** option resizes each column to fit its column header.

<figure><img src="https://1781349671-files.gitbook.io/~/files/v0/b/gitbook-x-prod.appspot.com/o/spaces%2FKyXRCFh0c08ryiUFvyMV%2Fuploads%2FpX4XXGdAs6Ur3oqP2CZ5%2Fimage.png?alt=media&amp;token=9807f380-c05d-4154-8947-a371886d8e56" alt=""><figcaption><p>Fit to header</p></figcaption></figure>

## 2. Fit to Content <a href="#id-2.-fit-to-content" id="id-2.-fit-to-content"></a>

Clicking on the **Fit to Content** option resizes each column to fit its content.

<figure><img src="https://1781349671-files.gitbook.io/~/files/v0/b/gitbook-x-prod.appspot.com/o/spaces%2FKyXRCFh0c08ryiUFvyMV%2Fuploads%2F5Og37PTqaIFaopSQYKHJ%2Fimage.png?alt=media&amp;token=c443abfd-49bd-498c-862b-a66025236f08" alt=""><figcaption><p>Fit to content</p></figcaption></figure>

## 3. Manage Column Width Manually

Click on **Manage Columns**. This menu allows you to enter the width for specific columns in pixels.

Enter the column width in pixels for the columns that you want to adjust.

<figure><img src="https://1781349671-files.gitbook.io/~/files/v0/b/gitbook-x-prod.appspot.com/o/spaces%2FKyXRCFh0c08ryiUFvyMV%2Fuploads%2FZBKm3ts5W30jCV10QCTL%2Fimage.png?alt=media&amp;token=b9cb0840-eb50-45a6-900f-592b300018b3" alt=""><figcaption><p>Set column width manually in pixels</p></figcaption></figure>

You can use the **Reset** option to restore the column widths to their original values before any changes were made.

<figure><img src="https://1781349671-files.gitbook.io/~/files/v0/b/gitbook-x-prod.appspot.com/o/spaces%2FKyXRCFh0c08ryiUFvyMV%2Fuploads%2FUOmXAg0qs7kXOv3HTU8V%2Fimage.png?alt=media&amp;token=3162e989-eac7-4df3-a6d6-4bf8bd838df9" alt=""><figcaption><p>Reset to initial values</p></figcaption></figure>

## 4. Lock column width <a href="#id-5.-lock-column-width" id="id-5.-lock-column-width"></a>

After you have adjusted the column widths as desired, you can lock the set column sizes to prevent users from changing them intentionally or unintentionally.

Click on the lock icon as shown below.

<figure><img src="https://1781349671-files.gitbook.io/~/files/v0/b/gitbook-x-prod.appspot.com/o/spaces%2FKyXRCFh0c08ryiUFvyMV%2Fuploads%2FvtHZvbp12x822jh0S2Kk%2Fimage.png?alt=media&amp;token=5f00e75a-fb40-4ef0-a6c9-bd016519c623" alt=""><figcaption><p>Lock Column Widths</p></figcaption></figure>

When the columns are locked, all options for adjusting column and row width are greyed out and unavailable, including the drag and adjust option.

<figure><img src="https://1781349671-files.gitbook.io/~/files/v0/b/gitbook-x-prod.appspot.com/o/spaces%2FKyXRCFh0c08ryiUFvyMV%2Fuploads%2FKBqSCJe1cYRx1Ic4peNj%2Fimage.png?alt=media&amp;token=838ccfdf-2785-4840-b8ee-dd49e0c0d5cc" alt=""><figcaption><p>Locked column width</p></figcaption></figure>

<figure><img src="https://1781349671-files.gitbook.io/~/files/v0/b/gitbook-x-prod.appspot.com/o/spaces%2FKyXRCFh0c08ryiUFvyMV%2Fuploads%2FyVePBNatsgaxQM2lckEA%2Fimage.png?alt=media&amp;token=a94495b7-cdaa-485a-b38c-3a18b2a95c48" alt=""><figcaption><p>Locked row and column width options</p></figcaption></figure>

To unlock and enable the column (and row) adjustments, click on **Manage Columns** and the lock icon again.

<figure><img src="https://1781349671-files.gitbook.io/~/files/v0/b/gitbook-x-prod.appspot.com/o/spaces%2FKyXRCFh0c08ryiUFvyMV%2Fuploads%2FLuUepp05ffDD4jUbRMEa%2Fimage.png?alt=media&amp;token=bb2cec6d-2899-4f77-8ef0-47c3aa2c9f57" alt=""><figcaption><p>Unlock column width options</p></figcaption></figure>


# Upload/Download Configuration

While you can configure the columns manually, if you want to replicate an existing configuration in a similar table, the **Upload and Download Configuration** options let you complete the process in just a few seconds.

This is accomplished by downloading the existing configurations to a text file using 'Download Configurations' and then reusing it later for a similar table using 'Upload Configurations'.

{% hint style="info" %}
When you connect to an existing table in the database, that is already configured, the configuration settings remain intact.&#x20;

Download and upload configuration options are helpful when you have to reset a visual to its original configuration or replicate the same setup in a table with similar fields.&#x20;
{% endhint %}

## Download Configurations

1. To download the existing configuration to a text file, click on **Download Configurations.**

<figure><img src="https://1781349671-files.gitbook.io/~/files/v0/b/gitbook-x-prod.appspot.com/o/spaces%2FKyXRCFh0c08ryiUFvyMV%2Fuploads%2FTsRyKI03kIPJuX1zUFqM%2Fimage.png?alt=media&amp;token=09f4268b-1d50-4096-85e1-55438d8a0a75" alt=""><figcaption><p>Download Configurations</p></figcaption></figure>

2. In the confirmation pop-up, click Download to download the file to your local system.&#x20;
3. Click **Save** to save the config file. This will export the column properties in .txt format.&#x20;

## Upload Configurations

To restore a visual to its original column setup or replicate a column configuration from another table, use the **Upload Configurations** option and import the saved configuration file. This includes any added columns as well as the general and display settings. Here’s how to do it:

1. After loading your table into PowerTable, click **Upload Configurations** to import the previously downloaded text file.

<figure><img src="https://1781349671-files.gitbook.io/~/files/v0/b/gitbook-x-prod.appspot.com/o/spaces%2FKyXRCFh0c08ryiUFvyMV%2Fuploads%2FVV0hTJRGFjakb73JgrZn%2Fimage.png?alt=media&amp;token=a477f9cb-7716-487c-a63d-8b3c8f1ddd7a" alt=""><figcaption><p>Upload Configurations</p></figcaption></figure>

2. Select **Click to Upload.** In the file explorer, select the text file you downloaded earlier.
3. Click **Upload.**
4. If conflicting properties exist, a pop-up will appear asking for confirmation to overwrite the existing column configuration. You'll also be prompted about additional columns, such as formulas or multi-select columns (if present), to confirm if you want to add them. You can check the required columns to select them and apply the configurations.
5. Click **Import** to proceed.
6. The columns will be configured and saved automatically with the imported configurations.


# Basic Table Operations

In this section, we will discuss all the table-editing capabilities offered by PowerTable, such as inserting, updating, deleting, copying, and duplicating rows. This section covers the following topics:

* Edit a single cell, a single row, or bulk-edit multiple rows.
* Find and replace data
* Insert a single row or multiple rows.
* Import data from files
* Copy, duplicate and delete rows

and more.


# Edit data

With PowerTable, you can edit the contents of your source table. All changes you make are synced with the source in real time.

To overwrite any existing data, simply double-click on the cell and enter the new data. In the toolbar, click **Save** to save the changes to the source.

<figure><img src="https://1781349671-files.gitbook.io/~/files/v0/b/gitbook-x-prod.appspot.com/o/spaces%2FKyXRCFh0c08ryiUFvyMV%2Fuploads%2FeOMUcU50o1iDxADfa1fn%2Fimage.png?alt=media&amp;token=8fba8146-0e5d-4831-be75-ef661ca86dd6" alt=""><figcaption><p>Edit data</p></figcaption></figure>

You can also edit a row using the form interface.

<figure><img src="https://1781349671-files.gitbook.io/~/files/v0/b/gitbook-x-prod.appspot.com/o/spaces%2FKyXRCFh0c08ryiUFvyMV%2Fuploads%2FaI9u1gZmdO6Epr2nMksV%2Fimage.png?alt=media&amp;token=ca11f68c-f88c-4496-b1d8-606e020315de" alt=""><figcaption><p>Editing a row using the form interface</p></figcaption></figure>


# Bulk Edit

Many applications only allow for single edits, such as inserting, updating, or deleting one row at a time. However, PowerTable offers the 'bulk edit' feature that enables you to edit and delete values across multiple cells simultaneously.&#x20;

With bulk editing, you can consistently update a common attribute across all entities, ensuring data integrity.&#x20;

<figure><img src="https://1781349671-files.gitbook.io/~/files/v0/b/gitbook-x-prod.appspot.com/o/spaces%2FKyXRCFh0c08ryiUFvyMV%2Fuploads%2FOLL1OtGiaRnotAnnsKoq%2Fimage.png?alt=media&amp;token=18dfe4e7-4dc4-460a-a04c-0e28c7a4c4e7" alt=""><figcaption><p>Bulk editor</p></figcaption></figure>

1. To edit multiple cells, select the required cells. To select all the rows in the table or remove the selection, click on the selector at the header.
2. After selecting the rows, click on **Edit** to open the bulk editor.
3. The Bulk Editor pop-up opens where you can specify the new value for the required fields and then click **Apply.**
4. Click on **Save** to save the changes and sync to the source database.

In this way, you can edit multiple cells/rows simultaneously using bulk editing.


# Find and Replace

PowerTable provides the 'Find and Replace' option to find a specific text or value and its occurrences in the table and then replace it with another text or value in one or more instances.

* Click on the highlighted icon beside the search bar to open the Find and Replace dialog box.

<figure><img src="https://1781349671-files.gitbook.io/~/files/v0/b/gitbook-x-prod.appspot.com/o/spaces%2FKyXRCFh0c08ryiUFvyMV%2Fuploads%2FUCiVCYoenLd8Es5f5lyX%2Fimage.png?alt=media&amp;token=658015f8-250a-467e-90c8-91ae21268986" alt=""><figcaption><p>Find and Replace</p></figcaption></figure>

The 'Find and Replace' dialog box opens.

<figure><img src="https://1781349671-files.gitbook.io/~/files/v0/b/gitbook-x-prod.appspot.com/o/spaces%2FKyXRCFh0c08ryiUFvyMV%2Fuploads%2FlvLD6xi900rSh7S1Ug3U%2Fimage.png?alt=media&amp;token=ff205dfe-18b9-4cdf-b362-7cea9d993e6d" alt=""><figcaption></figcaption></figure>

* Enter the word that you want to search in the 'Find' text box.
* In the 'Column' dropdown, select whether you want to search in all columns or only in a specific column.&#x20;
* You can check the options 'Match Case' and 'Match entire cell contents' to find the exact text or value you are looking for that matches the case and/or the entire cell contents.

<figure><img src="https://1781349671-files.gitbook.io/~/files/v0/b/gitbook-x-prod.appspot.com/o/spaces%2FKyXRCFh0c08ryiUFvyMV%2Fuploads%2FC89XyH7j5KYWAaXCh27z%2Fimage.png?alt=media&amp;token=b10aa721-8ffc-419a-a4ac-c6a5d0fe172d" alt=""><figcaption><p>Find the keyword</p></figcaption></figure>

* Click **Find Next** to locate the first occurrence and subsequent occurrences one by one. Click **Find Prev** to display the previous occurrence.

<figure><img src="https://1781349671-files.gitbook.io/~/files/v0/b/gitbook-x-prod.appspot.com/o/spaces%2FKyXRCFh0c08ryiUFvyMV%2Fuploads%2FkwaXg503NnTmYkYz0ANC%2Fimage.png?alt=media&amp;token=58d1b64e-5fd1-4ea5-88d9-d9d534718a4d" alt=""><figcaption><p>Find Next and Find Prev</p></figcaption></figure>

* Click **Find All** to locate all occurrences of the text/value at once.

<figure><img src="https://1781349671-files.gitbook.io/~/files/v0/b/gitbook-x-prod.appspot.com/o/spaces%2FKyXRCFh0c08ryiUFvyMV%2Fuploads%2FwPaac6PpJrP713xHi7yt%2Fimage.png?alt=media&amp;token=64429666-6f87-48bf-b140-9bfdfb665115" alt=""><figcaption><p>Find All</p></figcaption></figure>

*

Similarly, click "**Replace"** to replace the selected occurrence and "**Replace All"** to replace all occurrences.

#### **Search Options:**

**Match Case:** Check this box to find and locate only if the case of the entered text matches the data.

**Match entire cell contents:** Check this box to highlight the occurrence only if the entire cell content in the table matches the entered text.


# Insert rows

Using the **Insert Row** option, you can insert new, blank rows into the table manually.

{% hint style="info" %}
Use the [**Import**](/explore-powertable/working-with-powertable/basic-table-operations/bulk-import-rows) option to insert or update rows with data from an external file.
{% endhint %}

<figure><img src="https://1781349671-files.gitbook.io/~/files/v0/b/gitbook-x-prod.appspot.com/o/spaces%2FKyXRCFh0c08ryiUFvyMV%2Fuploads%2F4GXOmQpykn7i9teMuIkN%2Fimage.png?alt=media&amp;token=92d99739-e61a-4e92-ad0f-1ebe1be10814" alt=""><figcaption></figcaption></figure>

1. Click on **Insert Row** directly to insert a single row.
2. Use the dropdown menu next to the **Insert Row** option to choose whether you want to insert a single row or multiple rows at once.
3. Clicking on **Insert Row** inserts a single row.

<figure><img src="https://1781349671-files.gitbook.io/~/files/v0/b/gitbook-x-prod.appspot.com/o/spaces%2FKyXRCFh0c08ryiUFvyMV%2Fuploads%2FNKehevOeOp67A6NXowAq%2Fimage.png?alt=media&amp;token=c6f90861-defc-4c1b-bd99-4c9814bf8d0c" alt=""><figcaption><p>Insert a single row</p></figcaption></figure>

4. Click on **Insert Multiple Rows t**o insert multiple records. Enter the number of rows you wish to insert and click **Insert** to add them all at once.

<figure><img src="https://1781349671-files.gitbook.io/~/files/v0/b/gitbook-x-prod.appspot.com/o/spaces%2FKyXRCFh0c08ryiUFvyMV%2Fuploads%2F7YfzUtj5LFAKOnSasmTd%2Fimage.png?alt=media&amp;token=a2eec58a-d95b-410c-9121-8091217f2193" alt=""><figcaption><p>Insert multiple rows</p></figcaption></figure>

5. You can also insert rows using a form as shown below.

<figure><img src="https://1781349671-files.gitbook.io/~/files/v0/b/gitbook-x-prod.appspot.com/o/spaces%2FKyXRCFh0c08ryiUFvyMV%2Fuploads%2F6IrIvF3rgw4VFQc6xE9y%2Fimage.png?alt=media&amp;token=3cb64ccb-fe9c-4d50-9936-23ca0978c548" alt=""><figcaption><p>Insert using form</p></figcaption></figure>

{% hint style="info" %}
A maximum of 1000 rows can be inserted at a time.
{% endhint %}

{% hint style="info" %}
You can establish access control to define who can add new rows to the table. To know more, please refer to [this section.](https://docs.powertable.com/explore-powertable/working-with-powertable/basic-table-operations/pages/zDmYsHLaOQ7uXJjBcZUz#id-1.-add-new-rows)
{% endhint %}


# Bulk Import rows

It can be a tedious process to manually insert or update several rows. In such cases, you can bulk import the data directly from an external file.&#x20;

<figure><img src="https://1781349671-files.gitbook.io/~/files/v0/b/gitbook-x-prod.appspot.com/o/spaces%2FKyXRCFh0c08ryiUFvyMV%2Fuploads%2FW3B65N8s5Hq05qzRHSIl%2Fimage.png?alt=media&amp;token=f6995bb7-bda0-4e09-a8d5-94a16299a555" alt=""><figcaption><p>Import bulk data</p></figcaption></figure>

PowerTable allows you to insert and update multiple rows at once by importing CSV or Excel files. The rows are updated based on matching primary keys from the file.

1. To import new rows, click **Import** on the toolbar that opens the 'Import from file' pop-up.
2. Click on the space to upload an Excel or a CSV file.
3. Select the required file from the systems folder and click **Upload.**
4. You can view the uploaded data.&#x20;

* Records with existing primary keys are updated.&#x20;
* Records with new primary keys are inserted as new rows.
* Mismatches are flagged as errors that can be resolved by clicking on logs.

<figure><img src="https://1781349671-files.gitbook.io/~/files/v0/b/gitbook-x-prod.appspot.com/o/spaces%2FKyXRCFh0c08ryiUFvyMV%2Fuploads%2FFyQNXo1ogL9BoNtCYPRW%2Fimage.png?alt=media&amp;token=2dbb2658-93d1-409d-98d6-c10d2187ceef" alt=""><figcaption><p>Inserted rows</p></figcaption></figure>

{% hint style="info" %}

1. Ensure the XLSX/CSV file that you import contains the necessary primary key fields and other mandatory fields configured in the 'Columns' section.
2. The maximum number of new rows that can be inserted at once is 20000.
   {% endhint %}


# Delete rows

You can select one or more rows in the table and click on **Delete** to delete them.

<figure><img src="https://1781349671-files.gitbook.io/~/files/v0/b/gitbook-x-prod.appspot.com/o/spaces%2FKyXRCFh0c08ryiUFvyMV%2Fuploads%2FUI66LbjEqtjuZCITpvad%2Fimage.png?alt=media&amp;token=8faff11b-0e52-4a45-805a-e7ffc37ad179" alt=""><figcaption><p>Delete a single row</p></figcaption></figure>

<figure><img src="https://1781349671-files.gitbook.io/~/files/v0/b/gitbook-x-prod.appspot.com/o/spaces%2FKyXRCFh0c08ryiUFvyMV%2Fuploads%2FFmjg8WTOlL2z4XM5CU12%2Fimage.png?alt=media&amp;token=3333c559-b628-4dbf-b894-be40fb7799f0" alt=""><figcaption><p>Deleting multiple rows</p></figcaption></figure>

After clicking on **Proceed** in the confirmation pop-up, the selected rows are deleted.

If you have set up an approval workflow, the deletion process will go through this workflow before the actual deletion occurs. You can also choose to perform a soft delete or permanently delete the data, as explained in [this section.](/explore-powertable/access-control/row-permissions#delete-type)

{% hint style="info" %}
You can establish access control to define who can delete rows in the table. For configuration instructions, please refer to [this section.](https://docs.powertable.com/explore-powertable/working-with-powertable/basic-table-operations/pages/zDmYsHLaOQ7uXJjBcZUz#id-3.-delete)
{% endhint %}


# Duplicate rows

If you have to create similar records, you can duplicate rows and edit a few attributes.&#x20;

1. Select one or more rows and click on **Duplicate** to duplicate the rows.

<figure><img src="https://1781349671-files.gitbook.io/~/files/v0/b/gitbook-x-prod.appspot.com/o/spaces%2FKyXRCFh0c08ryiUFvyMV%2Fuploads%2FQf2fTVnMLkTput98FnRa%2Fimage.png?alt=media&amp;token=2fefe28e-9cdd-440d-bf66-cd6c2007f526" alt=""><figcaption><p>Duplicate row</p></figcaption></figure>

You'll be prompted to edit unique primary keys after duplication, as they will also be copied.


# Copy rows

PowerTable allows you to copy records to the clipboard for pasting into external applications like Excel or Word.

Select one or more rows you want to copy and click on the **Copy to Clipboard** ico&#x6E;**.**

<figure><img src="https://1781349671-files.gitbook.io/~/files/v0/b/gitbook-x-prod.appspot.com/o/spaces%2FKyXRCFh0c08ryiUFvyMV%2Fuploads%2F0q7eQdnS2rcMrGF2VGmG%2Fimage.png?alt=media&amp;token=44602816-9297-45d0-98ce-072d2547759a" alt=""><figcaption><p>Copy to clipboard</p></figcaption></figure>


# Preview Changes

When there are a lot of changes to the table, it can be difficult to track and confirm them before saving them to the database. PowerTable allows you to preview all changes made to the table at once and save or discard them as needed.

{% hint style="info" %}
Previewing changes is different from the audit log.&#x20;

The [audit log](broken://pages/Qurv5UQ3JnbbDkGCbBHb) provides a comprehensive list of all changes saved to the database, whereas this menu displays changes that have not yet been saved.
{% endhint %}

1. The menu bar section on the right displays the total number of changes made to the table.

<figure><img src="https://1781349671-files.gitbook.io/~/files/v0/b/gitbook-x-prod.appspot.com/o/spaces%2FKyXRCFh0c08ryiUFvyMV%2Fuploads%2FzfvE4PmJ2d2SI9lAMgiX%2Fimage.png?alt=media&amp;token=cb1921b2-d151-4a0f-97da-6f5b4e5e98ab" alt=""><figcaption><p>number of changes made</p></figcaption></figure>

2. Upon **clicking**, it displays the list of changes, along with the type of changes. You can view all changes by clicking **All**, or select the required tab to view records with a specific type of change.

<figure><img src="https://1781349671-files.gitbook.io/~/files/v0/b/gitbook-x-prod.appspot.com/o/spaces%2FKyXRCFh0c08ryiUFvyMV%2Fuploads%2FTUVjZfaY3A0VRlvaJTM0%2Fimage.png?alt=media&amp;token=89b9795d-47c3-497e-9a3c-8b870cc8c00f" alt=""><figcaption><p>List with the type of changes made</p></figcaption></figure>

3. You can click on **Save** to save the changes to the database.

<figure><img src="https://1781349671-files.gitbook.io/~/files/v0/b/gitbook-x-prod.appspot.com/o/spaces%2FKyXRCFh0c08ryiUFvyMV%2Fuploads%2FHjQwTStbKRbV2o1p0Kp8%2Fimage.png?alt=media&amp;token=2a0e9688-f52e-41af-b073-625f09e89f18" alt=""><figcaption><p>Save changes</p></figcaption></figure>

4. The preview screen also allows you to reset the changes you have made. Click on the row that you want to reset and choose **Reset.**

<figure><img src="https://1781349671-files.gitbook.io/~/files/v0/b/gitbook-x-prod.appspot.com/o/spaces%2FKyXRCFh0c08ryiUFvyMV%2Fuploads%2FBGnyL7ofrmgsndFXNkem%2Fimage.png?alt=media&amp;token=681699dc-754f-4e32-84a0-46e4afc3f907" alt=""><figcaption></figcaption></figure>


# Explore your data

This section covers the following options for exploring data:

**Search and filter:** When dealing with a large volume of data, the search and filter options can help you find specific records/details. [This section](/explore-powertable/working-with-powertable/explore-data/search-and-filter) demonstrates how to find and filter the necessary data.

**Sort and reorder:** Standard sorting orders, such as ascending and descending, can be applied to both numerical and non-numerical columns to arrange the records in a systematic manner and analyze them. Columns can also be reordered. [This section](/explore-powertable/working-with-powertable/explore-data/sort-and-reorder) covers both.

**Show/Hide columns:** [This section](/explore-powertable/working-with-powertable/explore-data/show-hide-columns) describes how to display or hide columns in a table, particularly one with too many columns.

**Pin columns:** [This section](/explore-powertable/working-with-powertable/explore-data/pin-columns) explains how to pin and freeze columns in a table.

**Column Insights:** Get column summary and essential information to gain insights using the [Insights](/explore-powertable/working-with-powertable/explore-data/column-insights) option.


# Search and filter

We will now explore the various options in PowerTable for searching and filtering data. These options allow you to analyze data in chunks, especially when dealing with a large volume of data.

## 1. Search

The 'Search' option allows you to quickly locate specific records in your table by entering characters, words, numbers, or phrases. PowerTable displays all records containing the entered character, number, or text.

1. Use the 'Search' option to start searching for specific records.

<figure><img src="https://1781349671-files.gitbook.io/~/files/v0/b/gitbook-x-prod.appspot.com/o/spaces%2FKyXRCFh0c08ryiUFvyMV%2Fuploads%2FkQkccIOLA6fCEBw2lT3d%2Fimage.png?alt=media&amp;token=ae48edf3-273b-46a7-a1a8-ef61268034f6" alt=""><figcaption><p>Search bar</p></figcaption></figure>

2. Type the character/text in the search box. PowerTable starts narrowing down the matches as soon as you start typing.&#x20;

<figure><img src="https://1781349671-files.gitbook.io/~/files/v0/b/gitbook-x-prod.appspot.com/o/spaces%2FKyXRCFh0c08ryiUFvyMV%2Fuploads%2Fxm0Jlfvc12n7Sh1R9Ors%2Fimage.png?alt=media&amp;token=605b21e1-66f6-43ff-86cc-09ffe5827eac" alt=""><figcaption><p>Search for a record with text</p></figcaption></figure>

3. You can also search for numeric values.

<figure><img src="https://1781349671-files.gitbook.io/~/files/v0/b/gitbook-x-prod.appspot.com/o/spaces%2FKyXRCFh0c08ryiUFvyMV%2Fuploads%2FPFIWy9R1cgFqg4PfPQHW%2Fimage.png?alt=media&amp;token=0d222f2a-c4fe-4b02-8125-2ee66f212ed1" alt=""><figcaption><p>Search for numeric values</p></figcaption></figure>

{% hint style="info" %}
PowerTable searches across pages if the table spans over multiple pages.
{% endhint %}

## 2. Filter

PowerTable offers both basic and advanced column-based filtering options in a separate **Filter pane**, allowing you to filter specific data or a range of data based on your defined criteria.&#x20;

Click on the arrows to expand the Filter pane, which includes various column filters.

<figure><img src="https://1781349671-files.gitbook.io/~/files/v0/b/gitbook-x-prod.appspot.com/o/spaces%2FKyXRCFh0c08ryiUFvyMV%2Fuploads%2FoIzauFbl2QFAE6UVnYr3%2Fimage.png?alt=media&amp;token=7032f85c-61b4-4f4a-af30-a35d23f803be" alt=""><figcaption><p>Open Filter pane</p></figcaption></figure>

The filter pane opens, as below:

<figure><img src="https://1781349671-files.gitbook.io/~/files/v0/b/gitbook-x-prod.appspot.com/o/spaces%2FKyXRCFh0c08ryiUFvyMV%2Fuploads%2FVQTX9aCUuhVHnJ50oE2X%2Fimage.png?alt=media&amp;token=ab75c42e-174e-4208-bf39-802c59ec1844" alt=""><figcaption><p>Filter pane with column filters</p></figcaption></figure>

### 2.1. Basic Filter

Using the basic filter option, you can select specific records directly. You can select the 'Require single selection' box to enable selecting only one option at a time.&#x20;

<figure><img src="https://1781349671-files.gitbook.io/~/files/v0/b/gitbook-x-prod.appspot.com/o/spaces%2FKyXRCFh0c08ryiUFvyMV%2Fuploads%2FyLITJLmHj27ebrhk4y05%2Fimage.png?alt=media&amp;token=faec0f91-41ee-495c-ae26-bd2b47f47a8f" alt=""><figcaption><p>Basic filter</p></figcaption></figure>

**'Require single selection' is selected:**

Since single selection is enabled in the example below, you can choose only one option to filter the products at a time.

<figure><img src="https://1781349671-files.gitbook.io/~/files/v0/b/gitbook-x-prod.appspot.com/o/spaces%2FKyXRCFh0c08ryiUFvyMV%2Fuploads%2FS9BHgjHBRz1NpPDp6S6v%2Fimage.png?alt=media&amp;token=d67abf54-07a3-4a22-a190-2ce63bc8ec46" alt=""><figcaption><p>Single selection</p></figcaption></figure>

**Searching for a filter criteria**

You can use the search box to look for specific criteria to filter by, especially when there are a lot of options.

<figure><img src="https://1781349671-files.gitbook.io/~/files/v0/b/gitbook-x-prod.appspot.com/o/spaces%2FKyXRCFh0c08ryiUFvyMV%2Fuploads%2Fu3Y8gYpHzWBDoSH1ceaZ%2Fimage.png?alt=media&amp;token=b631c50a-eb3e-4215-b204-72077a10858b" alt=""><figcaption><p>Search for a filter criterion</p></figcaption></figure>

### 2.2. Advanced filters <a href="#i-nested-and-grouped-filters" id="i-nested-and-grouped-filters"></a>

Use the advanced filtering option to filter based on specific criteria. Click the 'Advanced' tab and specify the condition. The displayed conditions vary based on the data type of the column selected.

You can also filter Top N records based on a numeric field.

#### 2.2.1. Number filter

To filter 'Number' type fields, you can use any of the below criteria highlighted in the image.

<figure><img src="https://1781349671-files.gitbook.io/~/files/v0/b/gitbook-x-prod.appspot.com/o/spaces%2FKyXRCFh0c08ryiUFvyMV%2Fuploads%2FzJ0ZqfX19YiEa9i23TWu%2Fimage.png?alt=media&amp;token=7af2d3dc-6320-4d99-a411-43fa5090eec7" alt=""><figcaption><p>number filters</p></figcaption></figure>

You can also use the slider or the text boxes to specify the range and filter the required values.

<figure><img src="https://1781349671-files.gitbook.io/~/files/v0/b/gitbook-x-prod.appspot.com/o/spaces%2FKyXRCFh0c08ryiUFvyMV%2Fuploads%2FiimjAixPaOTXqedjFRP1%2Fimage.png?alt=media&amp;token=07c00011-2403-4092-a6a0-3e33567c9469" alt=""><figcaption><p>Slider to filter based on a range</p></figcaption></figure>

In the example below, we have filtered the products with prices greater than $3000.

<figure><img src="https://1781349671-files.gitbook.io/~/files/v0/b/gitbook-x-prod.appspot.com/o/spaces%2FKyXRCFh0c08ryiUFvyMV%2Fuploads%2Fople1aXBHCW8QTUHE6JC%2Fimage.png?alt=media&amp;token=a21c108d-520e-491b-88f6-91df59ad0548" alt=""><figcaption><p>Records with prices>$3000</p></figcaption></figure>

#### 2.2.2. Text filter

The following criteria are available to filter text fields.

<figure><img src="https://1781349671-files.gitbook.io/~/files/v0/b/gitbook-x-prod.appspot.com/o/spaces%2FKyXRCFh0c08ryiUFvyMV%2Fuploads%2FgyNOY5CfOy1xS1h2tknx%2Fimage.png?alt=media&amp;token=b99c1588-6d67-4afc-bd55-a32c51ce336e" alt=""><figcaption><p>Text filters</p></figcaption></figure>

PowerTable helps you with auto-suggestions even while typing in your criteria.

<figure><img src="https://1781349671-files.gitbook.io/~/files/v0/b/gitbook-x-prod.appspot.com/o/spaces%2FKyXRCFh0c08ryiUFvyMV%2Fuploads%2FxV2aNX5IihjhmzJguqfm%2Fimage.png?alt=media&amp;token=6bbe5bb6-dce4-4d6e-a9c8-ab20825f53d2" alt=""><figcaption><p>help suggestions</p></figcaption></figure>

In the example below, we have filtered products whose color is either black or blue.

<figure><img src="https://1781349671-files.gitbook.io/~/files/v0/b/gitbook-x-prod.appspot.com/o/spaces%2FKyXRCFh0c08ryiUFvyMV%2Fuploads%2FUFbcexuwoBt2IDBrdUZ9%2Fimage.png?alt=media&amp;token=856af861-595c-405c-9a0a-5bf2e1b31287" alt=""><figcaption><p>filter for text fields</p></figcaption></figure>

#### 2.2.3. Nested filters

Add nested filters by applying multiple filter criteria simultaneously.

In the example below, we have filtered products that are black in color and have a price greater than 3000.

<figure><img src="https://1781349671-files.gitbook.io/~/files/v0/b/gitbook-x-prod.appspot.com/o/spaces%2FKyXRCFh0c08ryiUFvyMV%2Fuploads%2FnUok1J3dLzpMs4ar5TKr%2Fimage.png?alt=media&amp;token=574a66d9-c88f-4164-a233-9caa0ac68164" alt=""><figcaption><p>Nested filter</p></figcaption></figure>

#### **Clear a Filter**

Click on this icon to clear a specific filter.

<figure><img src="https://1781349671-files.gitbook.io/~/files/v0/b/gitbook-x-prod.appspot.com/o/spaces%2FKyXRCFh0c08ryiUFvyMV%2Fuploads%2F1UxjZTMn9lko1mdqa9WQ%2Fimage.png?alt=media&amp;token=ec655c07-8998-41a7-8efe-af45c01cdfdf" alt=""><figcaption><p>Clear filter</p></figcaption></figure>

#### Clear all filters

To clear all applied filters at once, click the highlighted icon.

<figure><img src="https://1781349671-files.gitbook.io/~/files/v0/b/gitbook-x-prod.appspot.com/o/spaces%2FKyXRCFh0c08ryiUFvyMV%2Fuploads%2FVBI4C2L6SBbd5E9SemSB%2Fimage.png?alt=media&amp;token=59efe08a-8cdc-42e4-a4c1-2816d8e177af" alt=""><figcaption><p>Clear all filters</p></figcaption></figure>

### 2.3. Top N filter

The 'Top N' filter option allows you to select the top 'n' records based on any numeric field. Click on the three dots on any field and choose **Top N**.

<figure><img src="https://1781349671-files.gitbook.io/~/files/v0/b/gitbook-x-prod.appspot.com/o/spaces%2FKyXRCFh0c08ryiUFvyMV%2Fuploads%2FqkOVWxBZGoqBdsnzY2kF%2Fimage.png?alt=media&amp;token=a2cc8086-3e05-4ecd-8564-7372a9f17039" alt=""><figcaption><p>Top N filter</p></figcaption></figure>

Enter the number of records to filter. Choose the field you want to filter by.

{% hint style="info" %}
Click the **Clear filter** icon beside the required filter to clear it or click **Reset All** to clear all the column filters applied.
{% endhint %}


# Sort and reorder

PowerTable provides standard sorting options to sort the records based on specific columns: ascending/descending as well as A > Z / Z > A for numeric and non-numeric columns such as date, numbers, dropdown, text, and more.&#x20;

## 1. Sort records <a href="#id-1.-sorting" id="id-1.-sorting"></a>

1. Hover over the column header you want to sort, then click on the three-dot menu.

<figure><img src="https://1781349671-files.gitbook.io/~/files/v0/b/gitbook-x-prod.appspot.com/o/spaces%2FKyXRCFh0c08ryiUFvyMV%2Fuploads%2FBgl5kGsJlCZbeXfhZBhP%2Fimage.png?alt=media&amp;token=8e4d3b30-1095-4bd0-9f3d-686de7fde0b1" alt=""><figcaption><p>Click on the column header menu</p></figcaption></figure>

2. Choose **Sort Descending** or **Sort Ascending** to sort the records in descending or ascending order, respectively. Let's now sort the 'Product SKU' column in ascending order (A > Z).

<figure><img src="https://1781349671-files.gitbook.io/~/files/v0/b/gitbook-x-prod.appspot.com/o/spaces%2FKyXRCFh0c08ryiUFvyMV%2Fuploads%2FElP8PLulTvPPDy3pebyX%2Fimage.png?alt=media&amp;token=3ed4f4a6-29f2-4ea1-9132-53e86779b789" alt=""><figcaption><p>Sort in ascending order</p></figcaption></figure>

The table is sorted as shown below:

<figure><img src="https://1781349671-files.gitbook.io/~/files/v0/b/gitbook-x-prod.appspot.com/o/spaces%2FKyXRCFh0c08ryiUFvyMV%2Fuploads%2Fhwg5YOwCyelwGzd8LmhH%2Fimage.png?alt=media&amp;token=1eb2b1b3-0b46-4337-9652-a52f0117b2c9" alt=""><figcaption><p>Records sorted in ascending order based on Product SKU</p></figcaption></figure>

3. To sort it in reverse order (in this case, descending order), either click the three dots in the header and select **Sort Descending** or simply click on the down arrow in the header.

<figure><img src="https://1781349671-files.gitbook.io/~/files/v0/b/gitbook-x-prod.appspot.com/o/spaces%2FKyXRCFh0c08ryiUFvyMV%2Fuploads%2FkD2u0trJZoDkrdL5cBUd%2Fimage.png?alt=media&amp;token=b2b3cb3a-41ee-4d54-9d36-bdab6bc227c8" alt=""><figcaption><p>Sort in descending order</p></figcaption></figure>

4. To remove the sort, click on the arrow again or choose the **Remove Sort** option from the menu.

<figure><img src="https://1781349671-files.gitbook.io/~/files/v0/b/gitbook-x-prod.appspot.com/o/spaces%2FKyXRCFh0c08ryiUFvyMV%2Fuploads%2FeOfE8oIbkJQHhmSjGSqN%2Fimage.png?alt=media&amp;token=f14f276d-1be0-4439-930b-786d6f25a10c" alt=""><figcaption><p>Remove sort</p></figcaption></figure>

## 2. Reorder columns

You can reorder columns by dragging and dropping the headers to arrange them the way you want.

<figure><img src="https://1781349671-files.gitbook.io/~/files/v0/b/gitbook-x-prod.appspot.com/o/spaces%2FKyXRCFh0c08ryiUFvyMV%2Fuploads%2FTfRS6AHCuciqwtVnJgZp%2Fdrag.gif?alt=media&amp;token=e83db6fa-a308-4f48-ac15-a54c21f3e708" alt=""><figcaption><p>Reorder columns</p></figcaption></figure>


# Show/Hide columns

PowerTable gives you the option to hide one or more columns from the table.

To hide a column, hover over its header, click on the three-dot menu and choose **Hide**.

<figure><img src="https://1781349671-files.gitbook.io/~/files/v0/b/gitbook-x-prod.appspot.com/o/spaces%2FKyXRCFh0c08ryiUFvyMV%2Fuploads%2F8AqbXhWiyKMDNxmtJmG1%2Fimage.png?alt=media&amp;token=99750084-2659-4cca-9d54-a8c6cf78f6e7" alt=""><figcaption></figcaption></figure>

The 'Product Description' column is now hidden.

<figure><img src="https://1781349671-files.gitbook.io/~/files/v0/b/gitbook-x-prod.appspot.com/o/spaces%2FKyXRCFh0c08ryiUFvyMV%2Fuploads%2FDKqAT0otmvyg2tqKVBy4%2Fimage.png?alt=media&amp;token=6496c901-7e4d-4051-b012-26b124466484" alt=""><figcaption></figcaption></figure>

To display the hidden column(s), click **Show All Columns** in the same menu from any header.

<figure><img src="https://1781349671-files.gitbook.io/~/files/v0/b/gitbook-x-prod.appspot.com/o/spaces%2FKyXRCFh0c08ryiUFvyMV%2Fuploads%2FofboJJiu2Z5FKRlCc7cZ%2Fimage.png?alt=media&amp;token=5fe44d53-1faa-4d65-b2fb-20f74cc7cbd7" alt=""><figcaption><p>Show all columns</p></figcaption></figure>


# Pin columns

Pinning a column allows you to keep specific columns visible on the left side of a table, even while scrolling the table horizontally.&#x20;

When there are too many columns in the table and you want to freeze a few important ones, you can pin them. When you pin a column, it moves to the left, ensuring that key columns, like IDs or descriptions, remain visible while other columns scroll.&#x20;

* Hover over the column header you want to pin, then click the three-dot menu and select **Pin** to pin it to the left. We will pin the 'Product Name' column here.

<figure><img src="https://1781349671-files.gitbook.io/~/files/v0/b/gitbook-x-prod.appspot.com/o/spaces%2FKyXRCFh0c08ryiUFvyMV%2Fuploads%2FF5reKhM26gSq7Yx14UQD%2Fimage.png?alt=media&amp;token=461bd717-e760-47fe-9b3c-56ea154fa26a" alt=""><figcaption><p>Pin column</p></figcaption></figure>

The column is now pinned.

<figure><img src="https://1781349671-files.gitbook.io/~/files/v0/b/gitbook-x-prod.appspot.com/o/spaces%2FKyXRCFh0c08ryiUFvyMV%2Fuploads%2FY0iJjCxSDaDQcFX1Msqv%2Fimage.png?alt=media&amp;token=a28fa65c-ceaf-401a-91af-4126a57636e2" alt=""><figcaption><p>Pinned column</p></figcaption></figure>

* To unpin a column, choose **Unpin** from the same menu on the header.

<figure><img src="https://1781349671-files.gitbook.io/~/files/v0/b/gitbook-x-prod.appspot.com/o/spaces%2FKyXRCFh0c08ryiUFvyMV%2Fuploads%2FUsep5mFrrxP8B1AF2ouj%2Fimage.png?alt=media&amp;token=437b0119-0a14-4304-b46f-02d7f5400503" alt=""><figcaption><p>Unpin column</p></figcaption></figure>

* You can pin multiple columns as shown below.

<figure><img src="https://1781349671-files.gitbook.io/~/files/v0/b/gitbook-x-prod.appspot.com/o/spaces%2FKyXRCFh0c08ryiUFvyMV%2Fuploads%2FEorJhCRMLF1l5fF29Odm%2Fimage.png?alt=media&amp;token=3e18f0d7-0ed3-4bfa-a8aa-f7b01cb10fe9" alt=""><figcaption><p>Pin multiple columns</p></figcaption></figure>

* To unpin all of them, select **Unpin All.** All columns get unpinned, returning to their original positions.

<figure><img src="https://1781349671-files.gitbook.io/~/files/v0/b/gitbook-x-prod.appspot.com/o/spaces%2FKyXRCFh0c08ryiUFvyMV%2Fuploads%2FN0vsj5Mz72Gg0zaat9ms%2Fimage.png?alt=media&amp;token=f10c8d80-2344-407c-9fbe-0a643b0afc44" alt=""><figcaption><p>'Un-pin all' option</p></figcaption></figure>


# Group Rows By

The **Group By** feature allows users to organize and group rows based on a shared attribute, such as category, status, or date.

Grouping rows improves readability and simplifies navigation, especially in larger datasets. You can easily collapse and expand individual groups or the entire outline, giving you control over the level of detail you want to see.

1. To group rows based on an attribute, click on **Group By.**

<figure><img src="https://1781349671-files.gitbook.io/~/files/v0/b/gitbook-x-prod.appspot.com/o/spaces%2FKyXRCFh0c08ryiUFvyMV%2Fuploads%2FC0FcKKGV1BBpnjc4wOOy%2Fimage.png?alt=media&amp;token=86e50778-2d04-449f-9bb7-faf316fffd7d" alt=""><figcaption><p>Click on 'Group By'</p></figcaption></figure>

2. Choose the column by which the records should be grouped. In the example below, we are grouping rows based on product subcategory.

<figure><img src="https://1781349671-files.gitbook.io/~/files/v0/b/gitbook-x-prod.appspot.com/o/spaces%2FKyXRCFh0c08ryiUFvyMV%2Fuploads%2FwXhgdldxuaQHptuEwaFA%2Fimage.png?alt=media&amp;token=7370f9df-fdaf-4d4c-927e-df3911ffdc14" alt=""><figcaption><p>Group by product sub-category</p></figcaption></figure>

3. To view the list of items within a group, click on the symbol '>', next to the required group name. The expanded list is shown below:

<figure><img src="https://1781349671-files.gitbook.io/~/files/v0/b/gitbook-x-prod.appspot.com/o/spaces%2FKyXRCFh0c08ryiUFvyMV%2Fuploads%2FSZ4ZG0YiFicb3K6Xv0bn%2Fimage.png?alt=media&amp;token=10cf9bda-29d3-41e0-a275-3ba84b553a4e" alt=""><figcaption><p>Expanded group</p></figcaption></figure>

4. Within a group, you can create as many sub-groups as possible. Click on **Add Sub Group** to create a subgroup.

<figure><img src="https://1781349671-files.gitbook.io/~/files/v0/b/gitbook-x-prod.appspot.com/o/spaces%2FKyXRCFh0c08ryiUFvyMV%2Fuploads%2FHZ2XpCoJ6gLH78sJJWy4%2Fimage.png?alt=media&amp;token=9f88c363-b3c7-4942-9818-0daf888c6eec" alt=""><figcaption><p>Add Subgroup</p></figcaption></figure>

5. Choose another column to group them inside the primary group. We will select 'Model Name'.

<figure><img src="https://1781349671-files.gitbook.io/~/files/v0/b/gitbook-x-prod.appspot.com/o/spaces%2FKyXRCFh0c08ryiUFvyMV%2Fuploads%2FY9gGMwinpePvaNEGKpzB%2Fimage.png?alt=media&amp;token=ce6c5838-2206-4a54-a0c9-df42b3f6e28d" alt=""><figcaption><p>Grouping by another column within a group</p></figcaption></figure>

The results are as below:

<figure><img src="https://1781349671-files.gitbook.io/~/files/v0/b/gitbook-x-prod.appspot.com/o/spaces%2FKyXRCFh0c08ryiUFvyMV%2Fuploads%2FB1bs6nzCO1tWp25QKeMx%2Fimage.png?alt=media&amp;token=9f481fbb-b181-4ed4-8837-0c889052ee2d" alt=""><figcaption><p>Groups and sub-groups</p></figcaption></figure>

6. You can use the bin icon to ungroup a particular group. To return to the table, ungroup all of them by clicking the bin icon on all groups.

<figure><img src="https://1781349671-files.gitbook.io/~/files/v0/b/gitbook-x-prod.appspot.com/o/spaces%2FKyXRCFh0c08ryiUFvyMV%2Fuploads%2FlrvWQTeOZGaCYWm5VVYs%2Fimage.png?alt=media&amp;token=55b7c170-392a-4810-8eaf-c2216e9a72e1" alt=""><figcaption><p>Ungrouping a group</p></figcaption></figure>

#### Note:

1. Click on the arrows before the group/sub-group names to expand or collapse them.

<figure><img src="https://1781349671-files.gitbook.io/~/files/v0/b/gitbook-x-prod.appspot.com/o/spaces%2FKyXRCFh0c08ryiUFvyMV%2Fuploads%2FgtbuAcpv54yzkL2GJfIY%2Fimage.png?alt=media&amp;token=b78d1e71-9fc6-4ec8-8aa7-9b14920b5be0" alt=""><figcaption><p>Expand/collapse groups and sub-groups</p></figcaption></figure>

2. You can edit the table and perform actions like formatting, bulk-editing, inserting rows, using find and replace, sorting, etc. on grouped rows also.

<figure><img src="https://1781349671-files.gitbook.io/~/files/v0/b/gitbook-x-prod.appspot.com/o/spaces%2FKyXRCFh0c08ryiUFvyMV%2Fuploads%2Fcr7Vz7zzRrU8h605QeET%2Fimage.png?alt=media&amp;token=1709648b-d68b-4fb6-8506-e27aadc60902" alt=""><figcaption><p>editing, formatting and inserting rows in a grouped table</p></figcaption></figure>


# Column Insights

The Insights option displays an overview of column values, allowing you to quickly extract key information and insights from column measures and make informed decisions.

Assume you are working with a large dataset and need to review any column to determine the number of missing or unique entries or perform a simple categorization analysis. You may want to find the earliest and latest dates in your data, or you may need to calculate the column data's range, average, median, or standard deviation.

The Insights option allows you to perform all of these tasks more efficiently while gathering useful insights.&#x20;

<figure><img src="https://1781349671-files.gitbook.io/~/files/v0/b/gitbook-x-prod.appspot.com/o/spaces%2FKyXRCFh0c08ryiUFvyMV%2Fuploads%2FC8fiGeQJ8K9v9HvCdmm7%2Fimage.png?alt=media&amp;token=d2eae615-2243-4147-9aa3-9ae9a4116b85" alt=""><figcaption><p>Insights</p></figcaption></figure>

Here are some details you can get:

* Sum
* Average
* Median
* Minimum value, maximum value and range
* Standard deviation
* Number of empty entries/percentage of empty entries
* Number of filled-in entries/percentage of filled-in entries
* Number of unique entries/percentage of unique entries
* Earliest and the most recent date in a date column
* Date range in days or months

In the example below, we have applied the 'Insights' option to a few columns.

<figure><img src="https://1781349671-files.gitbook.io/~/files/v0/b/gitbook-x-prod.appspot.com/o/spaces%2FKyXRCFh0c08ryiUFvyMV%2Fuploads%2FHDpVFXoPd9Xz1Wp8yonu%2Fimage.png?alt=media&amp;token=7ae72a0a-ed4d-4e79-a92a-50859879e0e2" alt=""><figcaption></figcaption></figure>


# Conditional Formatting

Conditional formatting is essential for directing users' attention to specific performance areas. It allows you to highlight or emphasize certain records using font styles, borders, icons, text and background colors making it easier to identify important data points.

The data in the table is formatted according to the user-configured rules. This section outlines how to configure and apply condition-based formatting to a table. You can create your own detailed conditional formatting rules from the ground up.

## Create Rule

1. **Create Rule:** To create a rule, click **Format Rules -> Create Rule.**

<figure><img src="https://1781349671-files.gitbook.io/~/files/v0/b/gitbook-x-prod.appspot.com/o/spaces%2FKyXRCFh0c08ryiUFvyMV%2Fuploads%2Fh2SkzehQl5DdZJgdSrSd%2Fimage.png?alt=media&amp;token=8423dabb-64bf-4800-b5f1-ef3dfa9db857" alt=""><figcaption><p>Create rule</p></figcaption></figure>

2. A side panel opens as shown below:

<figure><img src="https://1781349671-files.gitbook.io/~/files/v0/b/gitbook-x-prod.appspot.com/o/spaces%2FKyXRCFh0c08ryiUFvyMV%2Fuploads%2FJi64KnTdsOUYmSHNKPYy%2Fimage.png?alt=media&amp;token=ba66f671-3208-4aba-8acc-66f0e4e55df8" alt=""><figcaption><p>Conditional formatting configuration</p></figcaption></figure>

* **Title:** Enter a title for the rule in the **Title** field.
* **Apply to:** Select the column to be formatted in the 'Apply to' field. If you choose 'Rows', all columns will be formatted for the records that meet the condition.
* **Style:** Using the **Style** section, you can format text based on color, style, borders, background color, or specific icons.
* **Conditions:** In the 'Conditions' section, you can define the conditions using the dropdown options. Based on the type of column (text/numeric) selected, appropriate comparative functions and operators are displayed.
* **Add Condition:** You can add multiple conditions by clicking on **Add Rule.** You can then combine them using AND or OR operators.
* **Apply:** Click **Apply** to implement the rule or click the Back button to cancel.

## Manage Rules

When you have several conditional formatting rules in your report, you can easily view, modify or delete them using the 'Manage rules' option.

1. Click on **Format Rules -> Manage Rules.** A side panel opens and displays all the configured rules.
2. To add more rules, you can click on the **Add new rule** option from this side panel.
3. Click on the highlighted icons below to edit, duplicate, delete, or disable a specific rule.


# Layout Views

After you've set up your database in PowerTable and begun exploring your data, let's look at how you can view or visualize it for a quick summary and analysis.

In PowerTable, you can view your data in four different ways.

* Table view
* Gantt view
* Resource Gantt view
* Hierarchy view

Each view has capabilities that help you and your team to quickly identify and drill down to the required data. We also provide Gantt and Resource Gantt charts to help you track the progress of activities, milestones, and dependencies. Let's explore them:

## 1. Table View

This is the **default view** in PowerTable, where data is displayed in a table format with rows and columns. From other views, you can always return to table view by clicking on **Layout > Table.**

<figure><img src="https://1781349671-files.gitbook.io/~/files/v0/b/gitbook-x-prod.appspot.com/o/spaces%2FKyXRCFh0c08ryiUFvyMV%2Fuploads%2FLKY756401wQL75p9TzNA%2Fimage.png?alt=media&amp;token=21bd1e7d-d58d-4442-b1e1-dfc35a88048d" alt=""><figcaption><p>Table View</p></figcaption></figure>

## 2. Gantt View

PowerTable lets you use Gantt charts to visualize your task data. If your table contains a list of various activities or **tasks with their corresponding start and end dates**, you can use the **Gantt** option to track their progress.

A basic Gantt chart view is shown below:

<figure><img src="https://1781349671-files.gitbook.io/~/files/v0/b/gitbook-x-prod.appspot.com/o/spaces%2FKyXRCFh0c08ryiUFvyMV%2Fuploads%2F6eqQHEmv4hcgATKcxqqB%2Fimage.png?alt=media&amp;token=bd541ecb-3d39-4342-9482-894b07ea40e5" alt=""><figcaption><p>A basic Gantt chart</p></figcaption></figure>

Let's consider another example. This Gantt view, shown below, displays not only the start and end dates but also the subtasks organized in a hierarchical structure, along with information on progress, dependencies, and milestones.

<figure><img src="https://1781349671-files.gitbook.io/~/files/v0/b/gitbook-x-prod.appspot.com/o/spaces%2FKyXRCFh0c08ryiUFvyMV%2Fuploads%2FBoE0VmhpqCngJxFcZ1gJ%2Fimage.png?alt=media&amp;token=dbf912e4-ac3b-4f2b-844c-36fa45b315bb" alt=""><figcaption><p>Advanced Gantt chart</p></figcaption></figure>

[This section](/explore-powertable/layout-views/gantt-chart-view) provides a detailed explanation of how to create Gantt charts to track progress and dependencies between activities.

## 3. Resource View

When your data is a list of tasks with an assignee column and start and end dates, you can use the **Resource** layout to view the tasks summarized based on available resources, as well as the start and end dates of each of their tasks.

1. Click on **Layout > Resource.**

<figure><img src="https://1781349671-files.gitbook.io/~/files/v0/b/gitbook-x-prod.appspot.com/o/spaces%2FKyXRCFh0c08ryiUFvyMV%2Fuploads%2FuXoc9XJo7O7pTDgs1Dza%2Fimage.png?alt=media&amp;token=70bf1b12-0760-4cc2-9738-2c50d0f2daef" alt=""><figcaption><p>Click on 'Resource' Layout</p></figcaption></figure>

2. The **Column Mapping** pop-up opens. Select the resource field that you want to use for grouping the tasks, as well as the start date and end date fields from the relevant drop-down menus shown below. Here, we use the field 'QA Assignee' in the Resource drop-down. Click **Apply.**

<figure><img src="https://1781349671-files.gitbook.io/~/files/v0/b/gitbook-x-prod.appspot.com/o/spaces%2FKyXRCFh0c08ryiUFvyMV%2Fuploads%2F2uaBm2hrEqPpSIDfgRwJ%2Fimage.png?alt=media&amp;token=d3cbf6f3-0f64-4c23-aec1-db25f99be5f0" alt="" width="375"><figcaption><p>Column Mapping for Resource view</p></figcaption></figure>

3. The Resource view opens as below. You can see a list of resources, along with their assigned tasks and start and end dates.&#x20;

<figure><img src="https://1781349671-files.gitbook.io/~/files/v0/b/gitbook-x-prod.appspot.com/o/spaces%2FKyXRCFh0c08ryiUFvyMV%2Fuploads%2FqBcSuwHuCjd2gjkUKbwQ%2Fimage.png?alt=media&amp;token=c07f6ed8-c2cc-45d3-a49c-456aadad4f08" alt=""><figcaption><p>Resource view</p></figcaption></figure>

[This section](/explore-powertable/layout-views/resource-gantt) explains editing the resource view properties.

## 4. Hierarchy View

As the name implies, this view displays your data in the form of various hierarchical levels.&#x20;

A hierarchical view is possible for data with a parent-child or nested structure, such as an organizational chart, a product catalog, or a classification system. This view can be enabled when a data table contains fields to represent a self-referential relationship (such as a one-to-many relationship in which one data point refers to another within the same table).

1. Click on **Layout > Hierarchy.**

<figure><img src="https://1781349671-files.gitbook.io/~/files/v0/b/gitbook-x-prod.appspot.com/o/spaces%2FKyXRCFh0c08ryiUFvyMV%2Fuploads%2F602NjyRsVJas7X0wEQyb%2Fimage.png?alt=media&amp;token=72bcfb2a-9825-4598-9928-203e6379d0d1" alt=""><figcaption><p>Select 'Hierarchy'</p></figcaption></figure>

2. The **Hierarchy Layout Configuration** box opens, where you can configure the primary key column and hierarchy column.

<figure><img src="https://1781349671-files.gitbook.io/~/files/v0/b/gitbook-x-prod.appspot.com/o/spaces%2FKyXRCFh0c08ryiUFvyMV%2Fuploads%2FVb1s0MEMJNMV1UIy4ytb%2Fimage.png?alt=media&amp;token=34adf61a-ddc4-48ab-98a9-33225d6f436c" alt=""><figcaption><p>Configure Hierarchy column</p></figcaption></figure>

3. Select the 'Display Column'.

<figure><img src="https://1781349671-files.gitbook.io/~/files/v0/b/gitbook-x-prod.appspot.com/o/spaces%2FKyXRCFh0c08ryiUFvyMV%2Fuploads%2FRhKyv2gUZsWQciWe7F1N%2Fimage.png?alt=media&amp;token=81745c17-1964-4495-9e9e-db614c8976fa" alt=""><figcaption><p>Display column</p></figcaption></figure>

More information on configuring the hierarchy view is available [here](/explore-powertable/layout-views/hierarchy-layout).

The data is shown in the hierarchy view as follows:

<figure><img src="https://1781349671-files.gitbook.io/~/files/v0/b/gitbook-x-prod.appspot.com/o/spaces%2FKyXRCFh0c08ryiUFvyMV%2Fuploads%2F4HWMXiQga2T0EosZAqAj%2Fimage.png?alt=media&amp;token=701620a9-c066-4828-a679-7f0806e9f881" alt=""><figcaption><p>Hierarchy View</p></figcaption></figure>

The following sections provide a detailed explanation of the various views and how to customize them.


# Gantt Chart View

A Gantt chart is a **popular project management tool** that displays tasks along a timeline, showing their duration, progress, and start and end dates. Tasks are listed vertically on the left, while horizontal bars (or Gantt bars) extend across the timeline on the right.

<figure><img src="https://1781349671-files.gitbook.io/~/files/v0/b/gitbook-x-prod.appspot.com/o/spaces%2FKyXRCFh0c08ryiUFvyMV%2Fuploads%2FQjFqISbEKK8JXevZtL8s%2Fimage.png?alt=media&amp;token=4f51ac40-3a86-459b-82bc-a7ed2abe3573" alt=""><figcaption></figcaption></figure>

The Gantt view enables illustrating each task's progress, duration, milestones, assignees, and task dependencies. With PowerTable, you can create a fully customizable Gantt chart for your data, allowing you to visualize task schedules, identify dependencies, allocate resources, and track deadlines.

Beyond visualizing your data, you can easily add new tasks and subtasks, edit timelines, milestones, and dependencies on the fly, and seamlessly scale your data—all while tracking progress through an up-to-date Gantt chart.

## 1. Components of Gantt Chart for Task Management

<figure><img src="https://1781349671-files.gitbook.io/~/files/v0/b/gitbook-x-prod.appspot.com/o/spaces%2FKyXRCFh0c08ryiUFvyMV%2Fuploads%2Fm619fl94FYmO7541LJjm%2Fimage.png?alt=media&amp;token=3ffffcc4-5994-4939-8c53-348400d3a06b" alt=""><figcaption><p>Gantt chart</p></figcaption></figure>

* **Duration:** The *Gantt bars* represent the duration of the task from the start to the end date across the timeline.
* **Progress:** Each bar has a *slider* that shows the task's progress. The multi-level timeline enables you to capture progress at a detailed level.
* **Milestones:** Track important events, deadlines, and a process's completion using milestones. **When a task has an end date but no start date**, or **when there is an extra date field to indicate the milestones**, these tasks are indicated as milestones.
* **Dependencies:** You can use *connector lines* to visualize project-level dependencies between the tasks. The direction of connector lines helps in indicating the type of dependency, such as **Finish-Start, Start-Start, Finish-Finish, and Start-Finish.**
* **Formatting Gantt charts:** Apply conditional formatting to quickly identify status/risks. You can also indicate the critical paths/dependencies to mitigate project risks well in advance.

Let's explore how to enable a basic Gantt view for your task table.

{% hint style="success" %}

1. To generate a Gantt view, ensure your data consists of at least the 'Start Date' and 'End Date' fields along with the primary key field consisting of task IDs.
2. While PowerTable can automatically identify the data type of each field in the table, you must ensure that these date fields *(Start Date, End Date, Milestone Date)* are assigned the 'Date' data type in the initial table configuration window.&#x20;
3. The field containing the list of unique tasks should be the primary key.
   {% endhint %}

## 2. Creating Gantt Chart

### Basic Gantt

Let's consider a sample table with a list of tasks with start and end dates and create a basic Gantt chart.

1. Click on **Layout > Gantt.**&#x20;

<figure><img src="https://1781349671-files.gitbook.io/~/files/v0/b/gitbook-x-prod.appspot.com/o/spaces%2FKyXRCFh0c08ryiUFvyMV%2Fuploads%2F8MrVFinDJ3lpJDAvCQVe%2Fimage.png?alt=media&amp;token=a64e2705-8db7-4aab-be28-68cbdbedf751" alt=""><figcaption><p>Click on 'Gantt'</p></figcaption></figure>

2. The **Column Mapping** pop-up opens.&#x20;

* **Start Date and End Date:** Select the start date and end date fields in the relevant drop-down menus as shown below.
* **Task ID:** Since the Task ID is the primary key field in the table, it is automatically filled in the Task ID field.&#x20;
* Click **Apply.**

<figure><img src="https://1781349671-files.gitbook.io/~/files/v0/b/gitbook-x-prod.appspot.com/o/spaces%2FKyXRCFh0c08ryiUFvyMV%2Fuploads%2FG6ecQgKjP74teqLhhd0L%2Fimage.png?alt=media&amp;token=2591d632-017e-4958-ad71-591893d68c4d" alt=""><figcaption><p>Column Mapping for Gantt</p></figcaption></figure>

{% hint style="info" %}
If you want to create an advanced Gantt chart with additional information like milestones, progress, and dependencies, add these details to the database as additional fields.

Then, using the Gantt Layout Configuration pop-up, map these fields to the appropriate dropdown menus. To know more, refer to this section : [Advanced Gantt Chart](#id-3.-advanced-gantt-chart).
{% endhint %}

3. The Gantt view appears as shown below. This is a basic Gantt chart.&#x20;

<figure><img src="https://1781349671-files.gitbook.io/~/files/v0/b/gitbook-x-prod.appspot.com/o/spaces%2FKyXRCFh0c08ryiUFvyMV%2Fuploads%2FSU8dBPkXgWuoqgLFaHlv%2Fimage.png?alt=media&amp;token=67733adf-5cf3-47b4-ac77-bcaafbb4785a" alt=""><figcaption><p>Gantt Chart View</p></figcaption></figure>

### Advanced Gantt Chart

Let's now create an advanced Gantt chart indicating progress, milestones, and dependencies. In addition to the **start** and **end dates**, the table includes three other fields:&#x20;

* A numeric field to track progress
* A date-type field to indicate milestones
* A VARCHAR-type field to log connection details.

The above components are explained [here](#id-1.-components-of-gantt-chart-for-task-management).

<figure><img src="https://1781349671-files.gitbook.io/~/files/v0/b/gitbook-x-prod.appspot.com/o/spaces%2FKyXRCFh0c08ryiUFvyMV%2Fuploads%2FWBD1VGpUKNPjmclVfWzN%2Fimage.png?alt=media&amp;token=8bd2ee21-06ed-4365-afdf-51986ac3d990" alt=""><figcaption></figcaption></figure>

1. Click on **Layout > Gantt** to create a Gantt chart.&#x20;

*If you've already set up a basic Gantt and want to include these additional fields or change a few mapped fields, select* **Layout > Manage Layout**.

<figure><img src="https://1781349671-files.gitbook.io/~/files/v0/b/gitbook-x-prod.appspot.com/o/spaces%2FKyXRCFh0c08ryiUFvyMV%2Fuploads%2FN2mEkJ8AyszA0qs6Uxbi%2Fimage.png?alt=media&amp;token=65fcf1ab-3136-4933-b812-f51823146a8e" alt=""><figcaption><p>Manage Gantt Layout</p></figcaption></figure>

2. Assign the fields to relevant drop-down menus to generate a Gantt view.

<figure><img src="https://1781349671-files.gitbook.io/~/files/v0/b/gitbook-x-prod.appspot.com/o/spaces%2FKyXRCFh0c08ryiUFvyMV%2Fuploads%2Fwwk6vIBt5hUpBGBlZhyo%2Fimage.png?alt=media&amp;token=f692dfa3-d715-4846-8d4c-28b828c8be0d" alt=""><figcaption><p>Assign the fields</p></figcaption></figure>

**Parent ID:** Assign the Parent ID field here, if applicable, to organize tasks in parent-child hierarchical format. For Gantt view, this attribute is optional—assigning this only shows the task list arranged hierarchically.

(OR)

**Hierarchy By:** If there is no Parent ID field but the data has a hierarchical relationship, you can specify which field to organize the list by.

**Milestone:** Assign the 'Milestone' date field here. It should be a date data type.&#x20;

{% hint style="info" %}
*While PowerTable can automatically identify the data type of each field in the table, you must ensure that these date fields (Start Date, End Date, Milestone Date) are assigned the 'Date' data type in the initial table configuration window.*&#x20;
{% endhint %}

**Progress:** Select the '% Completion' or 'Progress' field here. It is a number field indicating the task progress using numbers.

**Dependency:** Assign the 'Dependency' field to capture task connection details. This field uses the format 'TaskID-ConnectionType', for example, 1002FS. Here, 1002 is the task ID, and FS indicates that the current task starts only after task 1002 has finished. Other connection types include SS (Start-Start), SF (Start-Finish), and FF (Finish-Finish).

3. Click **Apply.**

<figure><img src="https://1781349671-files.gitbook.io/~/files/v0/b/gitbook-x-prod.appspot.com/o/spaces%2FKyXRCFh0c08ryiUFvyMV%2Fuploads%2FSPeAIJWXwZy8jJuKwf0I%2Fimage.png?alt=media&amp;token=e86b5173-359e-4442-a478-6c48808d2a20" alt=""><figcaption></figcaption></figure>

The Gantt view is shown below:

<figure><img src="https://1781349671-files.gitbook.io/~/files/v0/b/gitbook-x-prod.appspot.com/o/spaces%2FKyXRCFh0c08ryiUFvyMV%2Fuploads%2FSYq497dfUqX0BOP84Kz2%2Fimage.png?alt=media&amp;token=151dfab6-1d5e-4364-9236-8d761d99a72c" alt=""><figcaption><p>Gantt Chart View</p></figcaption></figure>

In the absence of a 'Milestone' field, PowerTable can still assign milestones to tasks with no start date but an end date.&#x20;

<figure><img src="https://1781349671-files.gitbook.io/~/files/v0/b/gitbook-x-prod.appspot.com/o/spaces%2FKyXRCFh0c08ryiUFvyMV%2Fuploads%2FlmvxDJSGPJcdlXbLqbmv%2Fimage.png?alt=media&amp;token=3b814db6-1196-4016-bc3b-ee829fdb4ffd" alt=""><figcaption><p>Milestone - automatically created</p></figcaption></figure>

Similarly, when there are no progress or dependency fields in the database and you move the slider on any Gantt bar or manually draw connector lines on Gantt, PowerTable generates database columns named '*Progress*' and '*Connect To*' to indicate the task's progress and connection details.

<figure><img src="https://1781349671-files.gitbook.io/~/files/v0/b/gitbook-x-prod.appspot.com/o/spaces%2FKyXRCFh0c08ryiUFvyMV%2Fuploads%2F1aZcmrPu6CASmohkVEbu%2Fprogressconnector.gif?alt=media&amp;token=f5e2777b-46d2-4522-9093-3b727b62f19f" alt=""><figcaption><p>Progress and Connector fields added automatically</p></figcaption></figure>

{% hint style="info" %}
It should be noted that the 'Progress' and 'Connect To' columns created by PowerTable are database columns and will only become a part of the table after a 'Save' or a writeback operation.
{% endhint %}

In the next section, we'll discuss the customization options available for Gantt Chart.


# Resource Gantt


# Hierarchy Layout

When you are working with multilevel data, you can structure them using the hierarchy layout. PowerTable supports hierarchical layouts for viewing your data in addition to the 'Table' layout.&#x20;

This feature is helpful for use cases where data can be neatly organized into hierarchical structures, such as employee databases, categorical datasets, customer orders, and so on. You can configure a hierarchy layout for table data and then switch between them as needed.&#x20;

Let's take an example of the employee database in the default table view:

<figure><img src="https://1781349671-files.gitbook.io/~/files/v0/b/gitbook-x-prod.appspot.com/o/spaces%2FKyXRCFh0c08ryiUFvyMV%2Fuploads%2FrZ8zfd9slXhEq8DjMTMm%2Fimage.png?alt=media&amp;token=eb21b868-f334-4463-8070-055c46929527" alt=""><figcaption><p>Employee database</p></figcaption></figure>

The table consists of a list of 100,000 employees. Let us organize them in a hierarchical structure for easier navigation and a clear representation of who reports to whom.

**STEP 1:** Click on **Layout > Hierarchy** to set up the Hierarchy layout.

<figure><img src="https://1781349671-files.gitbook.io/~/files/v0/b/gitbook-x-prod.appspot.com/o/spaces%2FKyXRCFh0c08ryiUFvyMV%2Fuploads%2F602NjyRsVJas7X0wEQyb%2Fimage.png?alt=media&amp;token=72bcfb2a-9825-4598-9928-203e6379d0d1" alt=""><figcaption><p>Select hierarchy layout</p></figcaption></figure>

The layout configuration box opens, as below:

<figure><img src="https://1781349671-files.gitbook.io/~/files/v0/b/gitbook-x-prod.appspot.com/o/spaces%2FKyXRCFh0c08ryiUFvyMV%2Fuploads%2FVrDhV8yXDWnPBbqw5y9a%2Fimage.png?alt=media&amp;token=e6bc2af6-2251-4962-ab19-346ce19c74f9" alt=""><figcaption><p>Hierarchy Layout Configuration</p></figcaption></figure>

Alternatively, you can configure a hierarchy layout first by clicking on **Layout > Manage Layout.**&#x20;

**STEP 2:** Choose the **Primary Key Column.** The *EmployeeID* column here serves as the primary key for the employee table.&#x20;

<figure><img src="https://1781349671-files.gitbook.io/~/files/v0/b/gitbook-x-prod.appspot.com/o/spaces%2FKyXRCFh0c08ryiUFvyMV%2Fuploads%2FDw6WQkEPn8daOJX6YmK0%2Fimage.png?alt=media&amp;token=726435d4-72f3-4b4e-983a-b6b2c3a54446" alt=""><figcaption><p>Primary Key Column</p></figcaption></figure>

**STEP 3:** Choose the **Hierarchy Column.** The hierarchy column is the one containing the data that you want to use to group your records. This column represents the parent level for all records in the table.

We have chosen *ManagerID* as the hierarchy column because it not only uniquely identifies all managerial employees, but it also acts as a link between all employees and their managers.

<figure><img src="https://1781349671-files.gitbook.io/~/files/v0/b/gitbook-x-prod.appspot.com/o/spaces%2FKyXRCFh0c08ryiUFvyMV%2Fuploads%2F18HdKuSYlfCgAiw71tcD%2Fimage.png?alt=media&amp;token=36ee1824-8a71-4592-8836-004de075933f" alt=""><figcaption><p>Hierarchy column</p></figcaption></figure>

**STEP 4:** Select the column to be displayed in the hierarchy mode as the **Display Column.** This column should be different from the Hierarchy Column.

We have chosen the *FullName* column so that the full names of the managerial employees appear at the parent levels in the hierarchy mode. Click **Save.**

<figure><img src="https://1781349671-files.gitbook.io/~/files/v0/b/gitbook-x-prod.appspot.com/o/spaces%2FKyXRCFh0c08ryiUFvyMV%2Fuploads%2FAMXDJKEDiRlEUq4D1yOC%2Fimage.png?alt=media&amp;token=1b69bf38-f101-44db-aa97-e5ea3a70e926" alt=""><figcaption><p>Display name for hierarchy levels</p></figcaption></figure>

The hierarchy mode gets displayed, as below:

<figure><img src="https://1781349671-files.gitbook.io/~/files/v0/b/gitbook-x-prod.appspot.com/o/spaces%2FKyXRCFh0c08ryiUFvyMV%2Fuploads%2FRmrNoJDQbBHH0bRJPqCw%2Fimage.png?alt=media&amp;token=f3473a3e-c817-4dab-b1ec-667e63148257" alt=""><figcaption><p>Hierarchy mode</p></figcaption></figure>

* The display column is pinned, allowing you to scroll past other fields.&#x20;
* All employees are neatly organized under their managers, allowing for easier navigation and understanding.
* The number of child rows under each parent is displayed alongside it.

### Options available at the parent-level rows

<figure><img src="https://1781349671-files.gitbook.io/~/files/v0/b/gitbook-x-prod.appspot.com/o/spaces%2FKyXRCFh0c08ryiUFvyMV%2Fuploads%2Fdgi8cgwXNhTJj0gBDqi1%2Fimage.png?alt=media&amp;token=2654966c-adb5-43ef-ab77-3cb87967ce81" alt=""><figcaption></figcaption></figure>

#### Expand and Collapse Levels

You can use the arrows to expand or collapse the parent level. Alternatively, you can select the options —Expand and **Collapse**, respectively. Select **Collapse All** to collapse all parent levels in the table.

#### Move To

Select this option to move a specific record to another parent. Click this option, then choose from the list of parents to which the selected record will be moved.

#### Insert Child Row

To insert a child row for a record, select the three-dots menu and choose **Insert Child Row.** A new record is inserted where you can enter the details.

#### Show Hierarchy

Click on this option for any record to see its entire hierarchy.


# Access Control

Data security and integrity are essential in collaborative environments where multiple users work within a shared space. PowerTable addresses your security requirements by enabling you to configure permissions for rows and columns at a granular level.

You can precisely manage who can add, update, or delete rows and columns by specifying their email IDs. PowerTable also lets you set up rule-based access to rows and columns to further customize permissions.

This section outlines how to use the **Manage Access** menu to set row and column permissions, allowing or restricting specific users from performing certain actions (add, update, or delete).

We'll look at managing both

* [row permissions](/explore-powertable/access-control/row-permissions)
* [column permissions](/explore-powertable/access-control/column-permissions)


# Row Permissions

To set row-level permissions to your table, click on the **Set up** tab and choose **Manage Access.**

<figure><img src="https://1781349671-files.gitbook.io/~/files/v0/b/gitbook-x-prod.appspot.com/o/spaces%2FKyXRCFh0c08ryiUFvyMV%2Fuploads%2FKIInyHy2w281tuh5xcmO%2Fimage.png?alt=media&amp;token=2b521f73-1e6d-4b5c-83ab-d3028bdfb01f" alt=""><figcaption><p>Set up access control</p></figcaption></figure>

The 'Manage Access' window opens:

<figure><img src="https://1781349671-files.gitbook.io/~/files/v0/b/gitbook-x-prod.appspot.com/o/spaces%2FKyXRCFh0c08ryiUFvyMV%2Fuploads%2FquC0x06s8bX4kqzT3Btv%2Fimage.png?alt=media&amp;token=263a64c3-61ce-47fc-b7db-8d168dd86eea" alt=""><figcaption><p>Manage Access</p></figcaption></figure>

With 'Row Access' section, you can specify users who can add, update or delete rows.

## 1. Add new rows

Under the 'Add' section, you can specify who is allowed to add rows in the workspace. Here are the available options:

**No one:** Select this option to prevent users from adding new rows to your table.

<figure><img src="https://1781349671-files.gitbook.io/~/files/v0/b/gitbook-x-prod.appspot.com/o/spaces%2FKyXRCFh0c08ryiUFvyMV%2Fuploads%2FLmAY8s9jEb33OAqrcCUx%2Fimage.png?alt=media&amp;token=fa16b9b9-9652-4c81-b1d4-f91857639449" alt=""><figcaption><p>Disable adding rows</p></figcaption></figure>

**All users in this workspace:** Select this option to allow everyone in the workspace to add records.

<figure><img src="https://1781349671-files.gitbook.io/~/files/v0/b/gitbook-x-prod.appspot.com/o/spaces%2FKyXRCFh0c08ryiUFvyMV%2Fuploads%2FLLhCVQ8px0D71vX2jBcS%2Fimage.png?alt=media&amp;token=4516fda1-97d6-4d9e-a0c9-1cea54495b0f" alt=""><figcaption><p>Allow all workspace users to add rows</p></figcaption></figure>

**Specific users:** Choose this option to allow only certain users to add rows. Enter the email IDs of the users or the Active Directory (AD) groups you wish to grant access.

<figure><img src="https://1781349671-files.gitbook.io/~/files/v0/b/gitbook-x-prod.appspot.com/o/spaces%2FKyXRCFh0c08ryiUFvyMV%2Fuploads%2F9itMAXxDFzdgrYVAYQIw%2Fimage.png?alt=media&amp;token=7e2ef4bd-9a2b-4d3a-8f22-4be5724be687" alt=""><figcaption><p>Allow specific users to add rows</p></figcaption></figure>

Click **Save** to apply changes.

## 2. Update existing rows <a href="#id-2.-update" id="id-2.-update"></a>

In the 'Update' section, you can specify who has permission to update existing rows.

**No one:** Choose this option to prevent users from updating rows.

<figure><img src="https://1781349671-files.gitbook.io/~/files/v0/b/gitbook-x-prod.appspot.com/o/spaces%2FKyXRCFh0c08ryiUFvyMV%2Fuploads%2FpnUfGAA7HKSgCWleEM3o%2Fimage.png?alt=media&amp;token=6a1166b7-8f44-4056-8091-84f103c052d2" alt=""><figcaption><p>Disable row updates</p></figcaption></figure>

**All users in this workspace:** Select this option to allow all workspace users to update records.

<figure><img src="https://1781349671-files.gitbook.io/~/files/v0/b/gitbook-x-prod.appspot.com/o/spaces%2FKyXRCFh0c08ryiUFvyMV%2Fuploads%2FTSxIfQ2Vc88jL0sPudtt%2Fimage.png?alt=media&amp;token=6f5f15b4-1aab-4bba-8ed2-b20587b963a6" alt=""><figcaption><p>Allow all workspace users to update rows</p></figcaption></figure>

**Specific users in this workspace:** Choose this option to allow only certain workspace users to update the rows. Enter the email IDs of the users or the AD groups you want to allow.

<figure><img src="https://1781349671-files.gitbook.io/~/files/v0/b/gitbook-x-prod.appspot.com/o/spaces%2FKyXRCFh0c08ryiUFvyMV%2Fuploads%2F9nsGD3inn5GD0OJRMxq9%2Fimage.png?alt=media&amp;token=48303b23-cd79-4d14-8d22-b607c871f459" alt=""><figcaption><p>Allow specific users to update rows</p></figcaption></figure>

**Rule-based access:** Select this option to configure rules that specify the conditions under which a user or an Active Directory (AD) group can update rows in the table.&#x20;

The criteria for updating these rows can be established using column dimensions, allowing for a customized approach to data management and security.

<figure><img src="https://1781349671-files.gitbook.io/~/files/v0/b/gitbook-x-prod.appspot.com/o/spaces%2FKyXRCFh0c08ryiUFvyMV%2Fuploads%2FFc2PIjkSn76cwy5wdRrT%2Fimage.png?alt=media&amp;token=0f8f007a-df1f-4d84-b47b-9dac717f98c3" alt=""><figcaption><p>Rule-based update access</p></figcaption></figure>

1. Click on **Add Rule** to add a rule.

<figure><img src="https://1781349671-files.gitbook.io/~/files/v0/b/gitbook-x-prod.appspot.com/o/spaces%2FKyXRCFh0c08ryiUFvyMV%2Fuploads%2F6sTOPxpLMdgA5UEIXEua%2Fimage.png?alt=media&amp;token=20772bb5-1c7e-4f3d-99ea-f99342f86708" alt=""><figcaption><p>Add rule</p></figcaption></figure>

2. Enter the rule name, the filter condition, and the designated users who can update the rows for these dimensions. Click on **Add.**

<figure><img src="https://1781349671-files.gitbook.io/~/files/v0/b/gitbook-x-prod.appspot.com/o/spaces%2FKyXRCFh0c08ryiUFvyMV%2Fuploads%2FkHwyuuX9C15jjn0cSAtg%2Fimage.png?alt=media&amp;token=6ee24b19-4b28-4c75-abfe-f50e8f709675" alt=""><figcaption><p>Configuring condition in a rule</p></figcaption></figure>

3. You can add more filter criteria within a rule by clicking on **Add filter** and then combine them using AND or OR operators.

<figure><img src="https://1781349671-files.gitbook.io/~/files/v0/b/gitbook-x-prod.appspot.com/o/spaces%2FKyXRCFh0c08ryiUFvyMV%2Fuploads%2FDgCVHA70F0A9Twlz7PB3%2Fimage.png?alt=media&amp;token=48de02d1-31c4-4e46-8265-9a4494d5f084" alt=""><figcaption><p>Adding more than one condition in a rule</p></figcaption></figure>

4. You can set as many rules as required and assign corresponding users for each.

<figure><img src="https://1781349671-files.gitbook.io/~/files/v0/b/gitbook-x-prod.appspot.com/o/spaces%2FKyXRCFh0c08ryiUFvyMV%2Fuploads%2FRj4hEDO0VnJVmHLxREyT%2Fimage.png?alt=media&amp;token=cdf1987f-a76d-433a-abd2-ce459b478c39" alt=""><figcaption><p>Adding multiple rules</p></figcaption></figure>

5. Click **Save** to apply changes.

## 3. Delete rows <a href="#id-3.-delete" id="id-3.-delete"></a>

Under the 'Delete' section, you can specify which workspace users can delete rows.

**No one:** Choose this option to prevent users from deleting rows.

<figure><img src="https://1781349671-files.gitbook.io/~/files/v0/b/gitbook-x-prod.appspot.com/o/spaces%2FKyXRCFh0c08ryiUFvyMV%2Fuploads%2FbIcQHgh1f2ub5wPyZjKq%2Fimage.png?alt=media&amp;token=b254cd49-09f2-4b06-baae-f4b0931dce91" alt=""><figcaption><p>Disable row deletion</p></figcaption></figure>

**All users in this workspace:** Select this option to allow all workspace users to delete records.

<figure><img src="https://1781349671-files.gitbook.io/~/files/v0/b/gitbook-x-prod.appspot.com/o/spaces%2FKyXRCFh0c08ryiUFvyMV%2Fuploads%2FzX2tDwRhypF6KHZsQKMv%2Fimage.png?alt=media&amp;token=5d4652be-0bef-4ff6-ba24-8f689f21cf6e" alt=""><figcaption><p>Allow all workspace users to delete rows</p></figcaption></figure>

{% hint style="info" %}
You have two options when allowing users to delete rows: either set up a **soft delete** or let them **remove the rows permanently**. Refer to [this section](#delete-type) to know more.
{% endhint %}

**Specific users in this workspace:** Choose this option to allow only specific workspace users to delete rows. You can enter the email IDs of the users or the AD groups you want to allow.

<figure><img src="https://1781349671-files.gitbook.io/~/files/v0/b/gitbook-x-prod.appspot.com/o/spaces%2FKyXRCFh0c08ryiUFvyMV%2Fuploads%2FzWbPsOt6YR2St94Mza6c%2Fimage.png?alt=media&amp;token=8a9eb2b3-5937-4a75-9894-c870d86ab36c" alt=""><figcaption><p>Allow only specific users to delete rows</p></figcaption></figure>

**Rule-based access:** Select this option to configure rules that specify the conditions under which a user or an Active Directory (AD) group can delete rows in the table.&#x20;

The criteria for deleting these rows can be established using column dimensions, allowing for a customized approach to data management and security.

1. Click on **Add Rule** to add a rule.

<figure><img src="https://1781349671-files.gitbook.io/~/files/v0/b/gitbook-x-prod.appspot.com/o/spaces%2FKyXRCFh0c08ryiUFvyMV%2Fuploads%2F9pKXdX4kuMrXqIZud1Tf%2Fimage.png?alt=media&amp;token=a33bad6d-d815-42ec-bc60-128142128985" alt=""><figcaption><p>Add rule for delete access</p></figcaption></figure>

2. Enter the rule name, the filter condition, and the designated users who can delete these rows. Click on **Add.**

<figure><img src="https://1781349671-files.gitbook.io/~/files/v0/b/gitbook-x-prod.appspot.com/o/spaces%2FKyXRCFh0c08ryiUFvyMV%2Fuploads%2FK0q17kcocdLzbCgU26Lw%2Fimage.png?alt=media&amp;token=57d6965e-c650-4120-8ff6-967769528841" alt=""><figcaption><p>Configuring filter condition in a rule</p></figcaption></figure>

3. You can add more filter criteria within a rule by clicking on **Add filter** and then combine them using AND or OR operators.

<figure><img src="https://1781349671-files.gitbook.io/~/files/v0/b/gitbook-x-prod.appspot.com/o/spaces%2FKyXRCFh0c08ryiUFvyMV%2Fuploads%2Fmh5mMElcdAauD7Dc34HY%2Fimage.png?alt=media&amp;token=7144d1a1-c940-462a-8e00-e11705cde849" alt=""><figcaption><p>Adding more criteria within a rule</p></figcaption></figure>

4. You can set as many rules as required and assign corresponding users for each.

<figure><img src="https://1781349671-files.gitbook.io/~/files/v0/b/gitbook-x-prod.appspot.com/o/spaces%2FKyXRCFh0c08ryiUFvyMV%2Fuploads%2Fcz0ZjlbF7mtoJVxb2Qa0%2Fimage.png?alt=media&amp;token=ba904631-f78c-4074-887d-71ce627fe02d" alt=""><figcaption><p>Adding multiple rules</p></figcaption></figure>

5. Click **Save** to apply changes.

## Delete Type

With the 'Delete Type' option, you can configure whether users can delete rows permanently or do a soft delete.&#x20;

<figure><img src="https://1781349671-files.gitbook.io/~/files/v0/b/gitbook-x-prod.appspot.com/o/spaces%2FKyXRCFh0c08ryiUFvyMV%2Fuploads%2F2ObjRQdu5sTKZ5Lk40L0%2Fimage.png?alt=media&amp;token=a0da7cea-c8ee-40f8-8c5a-0bbaf013ca8e" alt=""><figcaption><p>Delete type</p></figcaption></figure>

**Permanent (Hard Delete):** When you select this option, the deleted rows are removed from the table or database permanently.&#x20;

**Mark as Deleted (Soft Delete):** When you select this option, the deleted rows remain in the database but are marked as deleted. This process involves setting a specific value to an existing column of the table when a row is deleted.&#x20;

For instance, we assign the value 'DELETED' to the 'Status' column for the rows that have been deleted.

<figure><img src="https://1781349671-files.gitbook.io/~/files/v0/b/gitbook-x-prod.appspot.com/o/spaces%2FKyXRCFh0c08ryiUFvyMV%2Fuploads%2FTbVoOkFRx609OI8DruIC%2Fimage.png?alt=media&amp;token=20d86b2a-1ad7-47da-a4f1-9c48f6a5a532" alt=""><figcaption><p>Mark row as deleted</p></figcaption></figure>

The deleted rows in the table look as below, after saving your changes:

<figure><img src="https://1781349671-files.gitbook.io/~/files/v0/b/gitbook-x-prod.appspot.com/o/spaces%2FKyXRCFh0c08ryiUFvyMV%2Fuploads%2Fwi2GRXw4SdsVJMmvFo7w%2Fimage.png?alt=media&amp;token=bec74e88-7d24-4e08-8ed4-e9130b27e70f" alt=""><figcaption><p>Deleted rows</p></figcaption></figure>

**Note:** In the above example, a new column called 'Status' has been created using the 'Add Database Column' option to track deleted rows.

#### **Show Deleted rows**

While soft-deleting rows, if the 'Show Deleted rows' option is selected, the deleted rows are shown as above in a grayed-out format.

When this option is unchecked, the deleted rows are hidden from the table.

<figure><img src="https://1781349671-files.gitbook.io/~/files/v0/b/gitbook-x-prod.appspot.com/o/spaces%2FKyXRCFh0c08ryiUFvyMV%2Fuploads%2F5lxyrU6tsOhmAHQcup2P%2Fimage.png?alt=media&amp;token=43b8a1b4-0441-44a0-9f49-bd460d77e675" alt=""><figcaption><p>Deleted rows are hidden</p></figcaption></figure>

You can use the audit log to keep track of all changes, including the list of permanently deleted and soft-deleted rows.

<figure><img src="https://1781349671-files.gitbook.io/~/files/v0/b/gitbook-x-prod.appspot.com/o/spaces%2FKyXRCFh0c08ryiUFvyMV%2Fuploads%2FuHjEs2UKEBeDgtfksrfa%2Fimage.png?alt=media&amp;token=556d16d5-c464-4ece-be00-b2bff326a8c0" alt=""><figcaption><p>Audit log</p></figcaption></figure>

In addition to row-level access control, you can also set up approval workflows so that every change made by a user goes through a review and approval process. This is explained in [this section](broken://pages/TKIqzng0msYl6vYq23R7).


# Column Permissions

Just as you can set row permissions, you can also establish column permissions.

By default, all workspace users who have access to the PowerTable item can view and modify all columns. Access control for each column can be configured through the 'Manage Access' menu. Here, you can clearly specify who is allowed to write values to each column.

To set up access permissions to the columns,

1. Click on the **Manage Access** menu from the **Setup** ta&#x62;**.**

<figure><img src="https://1781349671-files.gitbook.io/~/files/v0/b/gitbook-x-prod.appspot.com/o/spaces%2FKyXRCFh0c08ryiUFvyMV%2Fuploads%2FKIInyHy2w281tuh5xcmO%2Fimage.png?alt=media&amp;token=2b521f73-1e6d-4b5c-83ab-d3028bdfb01f" alt=""><figcaption><p>Manage Access</p></figcaption></figure>

2. Choose **Column Access** tab.

<figure><img src="https://1781349671-files.gitbook.io/~/files/v0/b/gitbook-x-prod.appspot.com/o/spaces%2FKyXRCFh0c08ryiUFvyMV%2Fuploads%2FT1CCMROa2u0iDljVqhy5%2Fimage.png?alt=media&amp;token=c2b0765f-e0b0-4241-b877-1ccb43aa387d" alt=""><figcaption><p>Column access</p></figcaption></figure>

3. To set permissions for a column, enter the name or email ID of the users to whom you wish to provide the access in the 'Who Can Edit' field.&#x20;

In the example below, we are setting access control for the 'Product SKU' column by specifying the users' name.

<figure><img src="https://1781349671-files.gitbook.io/~/files/v0/b/gitbook-x-prod.appspot.com/o/spaces%2FKyXRCFh0c08ryiUFvyMV%2Fuploads%2FceV2El4AJYuPYDtt8Tof%2Fimage.png?alt=media&amp;token=a00c7499-bfd2-4b2e-97d8-a83e02c83b39" alt=""><figcaption><p>Specify access control list</p></figcaption></figure>

4. You can enter as many users as you want. You can also type in the email ID of your organization group or active directory list.

<figure><img src="https://1781349671-files.gitbook.io/~/files/v0/b/gitbook-x-prod.appspot.com/o/spaces%2FKyXRCFh0c08ryiUFvyMV%2Fuploads%2FzeYY3rGewqSEdjLEtyeD%2Fimage.png?alt=media&amp;token=ac19526b-42bc-427b-979a-6731b3898061" alt=""><figcaption><p>Access control list who can edit 'Product SKU' column</p></figcaption></figure>

5. You can uncheck the 'Allow Edits' checkbox to prevent users from editing specific columns. Typically, the primary key field is locked from editing. Click **Save** to save the settings.&#x20;

<figure><img src="https://1781349671-files.gitbook.io/~/files/v0/b/gitbook-x-prod.appspot.com/o/spaces%2FKyXRCFh0c08ryiUFvyMV%2Fuploads%2FUw7LITriT5Na5h409tAB%2Fimage.png?alt=media&amp;token=230a51db-d867-4744-8be6-4c7bc8931344" alt=""><figcaption><p>Save the settings</p></figcaption></figure>


# Master-Detail Tables (Parent-Child Linked Records)

Master-detail tables are used to represent a one-to-many relationship between two entities. In this relationship, the data in one table (the **master** table) is related to multiple records in another table (the **detail** table).

Also known as **parent-child linked records**, this feature establishes a hierarchical relationship between two sets of records by connecting one record (the parent) to one or more related records (the children). This structure enables logical data grouping and is used to represent a master record along with its associated details. For example, there could be a list of *customers* (parent records), each with several *orders* (child records).

<figure><img src="https://1781349671-files.gitbook.io/~/files/v0/b/gitbook-x-prod.appspot.com/o/spaces%2FKyXRCFh0c08ryiUFvyMV%2Fuploads%2F4VcxtKIW3atfF4nsoJtx%2Fimage.png?alt=media&amp;token=383966ca-a201-4458-9d72-10b4a9b633a7" alt=""><figcaption><p>Master-Detail Tables</p></figcaption></figure>

#### **Why Use Master-Detail Tables?**

* **Organized Data Structure:** Group related records (such as orders and line items) for easier access and comprehension. This is especially useful when you are working with complex datasets.
* **Ensure Data Integrity:** Link all child records to their parent records to prevent inconsistent data entries that lack context. (e.g., an order item with no associated customer)
* **Streamlined Data Entry and Update:** Child records inherit values from their parents, making data updates easier and reducing duplication. For instance, you can add a common field to the master table instead of updating all child records.
* **Simplified Reporting & Filtering:** You can drill down and filter reports easily based on parent-level criteria.
* **Improved User Experience:** Master-detail view enables you to easily manage related data on a single screen.

#### Here's a breakdown of the key components:

**Master Table:** The master table contains unique records and serves as the main source of information. Each record in the master table represents a single entity or object. For example, in a product store database, the master table could be the 'categories' table, with each record representing a different product category.

<figure><img src="https://1781349671-files.gitbook.io/~/files/v0/b/gitbook-x-prod.appspot.com/o/spaces%2FKyXRCFh0c08ryiUFvyMV%2Fuploads%2F5xGbFhP3PlrNlzBWQAk4%2Fimage.png?alt=media&amp;token=98ca6409-5e30-490f-95e2-5fc3306e3813" alt=""><figcaption><p>Master table</p></figcaption></figure>

**Detail Table:** The detail table has related records that connect to one record in the master table. This establishes a link between the master table and its associated data. For example, the detail table could be the 'products' table, where each record represents a product belonging to one of the categories in the 'categories' table, as shown below.

<figure><img src="https://1781349671-files.gitbook.io/~/files/v0/b/gitbook-x-prod.appspot.com/o/spaces%2FKyXRCFh0c08ryiUFvyMV%2Fuploads%2FuiutCs1V9PPzie44GZkE%2Fimage.png?alt=media&amp;token=f990933e-85c3-4383-bad7-47f94ef602d9" alt=""><figcaption><p>Details table</p></figcaption></figure>

**Foreign Key Column:** The relationship between the master and the detail table is established through a common column known as the **foreign key**. The foreign key in one table (the detail table) references the primary key of another table (the master table).

In our example, each record in the *products* table refers to its associated parent record in the *categories* table using the foreign key **CategoryID**.

<figure><img src="https://1781349671-files.gitbook.io/~/files/v0/b/gitbook-x-prod.appspot.com/o/spaces%2FKyXRCFh0c08ryiUFvyMV%2Fuploads%2FpkWC5Y7t7Ac14j11wVLm%2Fimage.png?alt=media&amp;token=9229302a-fbd0-4209-8ab9-f0da93e665f0" alt=""><figcaption><p>Relation column/foreign key column</p></figcaption></figure>

The master table and detail table typically have a one-to-many relationship. This means that a single record in the master table can be linked to multiple records in the detail table, whereas each record in the detail table can only link to one record in the master table.

In the following sections, we'll look at how to create parent-child linked records and view the data in master-detail view.


# Creating Master-Detail Tables

If two or more tables in a dataset share a foreign key column (relation column), a master-detail relationship can be established between them. Establishing a master-detail view allows you to easily organize, scale, and maintain your data.

In our example, we have two tables: the *'categories'* table and the *'products'* table. They share a foreign key column, the '*Category ID'* column.&#x20;

<figure><img src="https://1781349671-files.gitbook.io/~/files/v0/b/gitbook-x-prod.appspot.com/o/spaces%2FKyXRCFh0c08ryiUFvyMV%2Fuploads%2FRT6SpJ8HMV0oQwiB0wnf%2Fimage.png?alt=media&amp;token=c5dfdc47-0a71-40e9-ad05-db83c5f4739b" alt=""><figcaption><p>Master table</p></figcaption></figure>

<figure><img src="https://1781349671-files.gitbook.io/~/files/v0/b/gitbook-x-prod.appspot.com/o/spaces%2FKyXRCFh0c08ryiUFvyMV%2Fuploads%2FmjdzPTCtuPfvvvLY0tOj%2Fimage.png?alt=media&amp;token=ae22a6f7-ae99-48e9-b107-9ad37f40bc43" alt=""><figcaption><p>Details table</p></figcaption></figure>

We can also use a [lookup column](https://docs.powertable.com/explore-powertable/master-detail-tables-parent-child-linked-records/pages/PCbjP6zrTFcrIPrKHx1g#id-3.-lookup-table) in the *products* table for the **CategoryID** field; this lookup column retrieves the corresponding category names from the *categories* table (key: CategoryID, value: CategoryName).

<figure><img src="https://1781349671-files.gitbook.io/~/files/v0/b/gitbook-x-prod.appspot.com/o/spaces%2FKyXRCFh0c08ryiUFvyMV%2Fuploads%2FvwAaT7jo6xKQpSrdHWmg%2Flookup%20md%20view.gif?alt=media&amp;token=2d491c77-6e40-4a32-a83d-c13a116a85a9" alt=""><figcaption></figcaption></figure>

Both tables look as shown below. Let's now create a master-detail relationship between these tables.

<figure><img src="https://1781349671-files.gitbook.io/~/files/v0/b/gitbook-x-prod.appspot.com/o/spaces%2FKyXRCFh0c08ryiUFvyMV%2Fuploads%2FnHrBVHpiioFlgabb7eUv%2Fimage.png?alt=media&amp;token=a793fa7f-40f3-44ce-84f6-af4bd871b2d9" alt=""><figcaption></figcaption></figure>

In the master table, you need to add a **relation column.** This column connects both tables using the foreign key.&#x20;

**STEP 1:** To add this column, go to **Setup > Columns.**

<figure><img src="https://1781349671-files.gitbook.io/~/files/v0/b/gitbook-x-prod.appspot.com/o/spaces%2FKyXRCFh0c08ryiUFvyMV%2Fuploads%2FQNrnNO6xAngtRYF36Iz8%2Fimage.png?alt=media&amp;token=cdc72687-99ca-4092-bc25-c8a36307f76c" alt=""><figcaption><p>Setup column</p></figcaption></figure>

**STEP 2:** In the 'Columns' window that opens, click on **Add Visual Column > Add Relation Column.**

<figure><img src="https://1781349671-files.gitbook.io/~/files/v0/b/gitbook-x-prod.appspot.com/o/spaces%2FKyXRCFh0c08ryiUFvyMV%2Fuploads%2F6lR6AXw1pKU2mYjjATX0%2Fimage.png?alt=media&amp;token=8ce689d4-84ea-43fc-97e3-37f76e8e5cd3" alt=""><figcaption><p>Add Relation Column</p></figcaption></figure>

**STEP 3:** Configure the required details as below:

* **Type:** Select the column type. We chose the 'Text' type because we wanted to display the category name.
* **Column Name:** Enter the name you wish to use for the new column.

<figure><img src="https://1781349671-files.gitbook.io/~/files/v0/b/gitbook-x-prod.appspot.com/o/spaces%2FKyXRCFh0c08ryiUFvyMV%2Fuploads%2FcHb3wjAZKYUJ8YNii8VM%2Fimage.png?alt=media&amp;token=53e429a6-211d-454e-a4c9-b303ddcf63a7" alt=""><figcaption><p>Type and Column Name</p></figcaption></figure>

#### Configure Relation Table

Enter the details of the child table that you want to connect to. To establish a connection to the *products* table, let's input the following details:

**Connection**: The name of the connection used to fetch the child table.

**Schema:** The name of the database schema where the table is available.

**Relation Table:** Select the necessary child table to connect to.

<figure><img src="https://1781349671-files.gitbook.io/~/files/v0/b/gitbook-x-prod.appspot.com/o/spaces%2FKyXRCFh0c08ryiUFvyMV%2Fuploads%2FoeqGDKuJbbH9BDdAw2vf%2Fimage.png?alt=media&amp;token=6b13fe1e-b9ae-4425-87d2-6ce407141086" alt=""><figcaption><p>Configure Relation Table</p></figcaption></figure>

#### Configure Relation Columns

**Column from Current Table:** Choose the foreign key column from the **current master table** as the relation column.

**Column from Relation Table:** Choose the foreign key column from the **relation table** as the relation column.

This is the column that connects both tables.

<figure><img src="https://1781349671-files.gitbook.io/~/files/v0/b/gitbook-x-prod.appspot.com/o/spaces%2FKyXRCFh0c08ryiUFvyMV%2Fuploads%2FeJQN5PrCVavbB6KUVUMX%2Fimage.png?alt=media&amp;token=d3eb7740-dbe1-4770-88b4-f9a722f4f202" alt=""><figcaption><p>Relation Column Configuration</p></figcaption></figure>

#### Configure Label Column

**Column To Display:** Choose the label/display name that will appear when you drill down a record to its details table.

<figure><img src="https://1781349671-files.gitbook.io/~/files/v0/b/gitbook-x-prod.appspot.com/o/spaces%2FKyXRCFh0c08ryiUFvyMV%2Fuploads%2FnAbPbo16HEPUu4SS275w%2Fimage.png?alt=media&amp;token=e56ecdca-7305-4dd5-bc9d-7dfc07e1264e" alt=""><figcaption><p>Configure Label Column</p></figcaption></figure>

<figure><img src="https://1781349671-files.gitbook.io/~/files/v0/b/gitbook-x-prod.appspot.com/o/spaces%2FKyXRCFh0c08ryiUFvyMV%2Fuploads%2FMaHiyS11JmTT9fw0JDpx%2Fimage.png?alt=media&amp;token=4f14a249-67ae-4f43-8ed9-38296682ae2d" alt=""><figcaption><p>Display name</p></figcaption></figure>

STEP 4: Click **Save** to save the configuration. The relation column is added.

<figure><img src="https://1781349671-files.gitbook.io/~/files/v0/b/gitbook-x-prod.appspot.com/o/spaces%2FKyXRCFh0c08ryiUFvyMV%2Fuploads%2F8VUvq5w2ZUrn3Adaa55E%2Fimage.png?alt=media&amp;token=7fbda72e-65c4-4e79-9e70-ffe472f828e1" alt=""><figcaption><p>Relation Column added</p></figcaption></figure>

The master-detail relationship is now established between the tables, as shown below:

<figure><img src="https://1781349671-files.gitbook.io/~/files/v0/b/gitbook-x-prod.appspot.com/o/spaces%2FKyXRCFh0c08ryiUFvyMV%2Fuploads%2Fj5Nz8R78PmdxryNjCV6B%2Fmd%20view.gif?alt=media&amp;token=a8e66ba6-a3b1-4700-8de4-1e97ae220049" alt=""><figcaption></figcaption></figure>


# Approval flow

PowerTable can connect to your database live for real-time data updates and synchronization. While row and column-level access permissions ensure data integrity, you can go one step further to secure your data by setting up approval workflows.

In a team, users might need management's approval before making any data changes to ensure correctness and accuracy. There can be scenarios like multiple users accidentally changing the same data, entering incorrect values, etc. All these can be streamlined by setting up an approval workflow process in PowerTable.

## 1. Approval flow sequence

Whenever a change is made,&#x20;

:ballot\_box\_with\_check: Approvers receive an email about the change request with a link to the table.

:ballot\_box\_with\_check: Changes are indicated in the table based on how they have been set to be handled.

:ballot\_box\_with\_check: Approvers review the log in the 'Review' tab and choose which changes to approve or reject.&#x20;

:ballot\_box\_with\_check: Author is notified via email about approval or rejection.

:ballot\_box\_with\_check: Approver can also propose changes to the author.

:ballot\_box\_with\_check: Author implements or skips the suggested changes and sends it again for review.

:ballot\_box\_with\_check: Approved changes are synced to the source.

This section explains all of the above in detail.

## 2. Steps to set up approval workflow

1. [Enable Approvals in PowerTable](#id-3.-enable-approvals)
2. [Select a method to choose approvers](#id-4.-select-approvers)
3. [Set up the way to handle the changes](/explore-powertable/approval-flow/handling-changes-before-approval)

Once enabled, every change made by users undergoes an approval process before getting saved and synced to the source.

## **3. Enable Approvals**

You can turn on the approval workflow by following the steps below:

1. Click on **Approvals.**

<figure><img src="https://1781349671-files.gitbook.io/~/files/v0/b/gitbook-x-prod.appspot.com/o/spaces%2FKyXRCFh0c08ryiUFvyMV%2Fuploads%2F5HtsNlRKaA8Zj2PZ2OS7%2Fimage.png?alt=media&amp;token=51326399-b1a4-48d6-98ed-f2c3ae7fcc5b" alt=""><figcaption><p>Click 'Approvals'</p></figcaption></figure>

2. Click **Configure Approvals.**

<figure><img src="https://1781349671-files.gitbook.io/~/files/v0/b/gitbook-x-prod.appspot.com/o/spaces%2FKyXRCFh0c08ryiUFvyMV%2Fuploads%2FhzDPHld3Er47sCha0rUL%2Fimage.png?alt=media&amp;token=38b93744-6393-4c2a-bc9f-30ae2e805906" alt=""><figcaption><p>Configure Approvals</p></figcaption></figure>

3. Enable approvals by toggling on the highlighted button.

<figure><img src="https://1781349671-files.gitbook.io/~/files/v0/b/gitbook-x-prod.appspot.com/o/spaces%2FKyXRCFh0c08ryiUFvyMV%2Fuploads%2FoA3XiGxEpQV9lzmtnDTG%2Fimage.png?alt=media&amp;token=334f3e22-d143-4964-af13-03b5e3e6c524" alt=""><figcaption><p>Enable approvals</p></figcaption></figure>

## 4. Select Approvers

The next step is to select the approvers who will review and approve any changes made to the table.&#x20;

There are three ways to select approvers.&#x20;

1. [**User Approvals:**](/explore-powertable/approval-flow/user-based-approvals) Manually entering the email IDs of approvers or IDs of AD groups (Active Directory Groups).
2. [**Rule-based Approvals:**](/explore-powertable/approval-flow/rule-based-approvals) Configuring a rule-based system to identify the approvers.
3. [**Approval using a Lookup Table:**](/explore-powertable/approval-flow/approval-using-a-lookup-table) Using a lookup table to establish the rules.

A detailed guide to each method is available in the upcoming sections.


# User-based Approvals

### Enter the list of users who can approve

This is a straightforward method where you will manually specify individuals who will act as approvers.&#x20;

1. Choose the option— **Specific users.**
2. Select specific users in the workspace by typing their names or email addresses who will be responsible for reviewing and approving the changes.&#x20;
3. Click **Save.**

<figure><img src="https://1781349671-files.gitbook.io/~/files/v0/b/gitbook-x-prod.appspot.com/o/spaces%2FKyXRCFh0c08ryiUFvyMV%2Fuploads%2FzOmiCsEhPUfPILOI0jTI%2Fimage.png?alt=media&amp;token=65a131e2-7fa6-4380-95e7-b100ff363c8d" alt=""><figcaption><p>Specific users as approvers</p></figcaption></figure>


# Rule-based Approvals

### **Identify Approvers based on configured rules**

Define approvers for specific columns or records in the table based on set rules and criteria. Enter the rule name, the filter criteria, and the designated approvers for that rule. You can set as many rules as required and assign corresponding approvers for each.

Note that rules are executed in the order they are added and can be reordered.&#x20;

The detailed steps are as follows:

1. Select the highlighted option below.

<figure><img src="https://1781349671-files.gitbook.io/~/files/v0/b/gitbook-x-prod.appspot.com/o/spaces%2FKyXRCFh0c08ryiUFvyMV%2Fuploads%2FwAMplzN6IW03X19fSK8g%2Fimage.png?alt=media&amp;token=e02cd92b-90ea-469f-a15f-71cf3d483bf8" alt=""><figcaption><p>Select users based on rules</p></figcaption></figure>

2. Click **Add Rule** to add a rule.

<figure><img src="https://1781349671-files.gitbook.io/~/files/v0/b/gitbook-x-prod.appspot.com/o/spaces%2FKyXRCFh0c08ryiUFvyMV%2Fuploads%2FCPyZs5W22M94HDOOQden%2Fimage.png?alt=media&amp;token=dffe1970-3baa-4559-b087-d9eb7721895e" alt=""><figcaption><p>Add Rule</p></figcaption></figure>

3. Enter a name for the rule, filter criteria, and approvers for the criteria.

<figure><img src="https://1781349671-files.gitbook.io/~/files/v0/b/gitbook-x-prod.appspot.com/o/spaces%2FKyXRCFh0c08ryiUFvyMV%2Fuploads%2Fr99UdlopokUtvcfQqarH%2Fimage.png?alt=media&amp;token=5c3732c5-0441-42ee-8313-995be4825a4c" alt=""><figcaption><p>Configure rule</p></figcaption></figure>

4. Click on **Add filter** to add multiple filters/criteria within a rule and combine them using AND or OR operators as below:

<figure><img src="https://1781349671-files.gitbook.io/~/files/v0/b/gitbook-x-prod.appspot.com/o/spaces%2FKyXRCFh0c08ryiUFvyMV%2Fuploads%2FHYrgJQNuGLKVf65Q2MHk%2Fimage.png?alt=media&amp;token=c41e3881-7d19-4741-b323-9ae83d411300" alt=""><figcaption><p>Multiple filter criteria</p></figcaption></figure>

5. To delete a filter criteria, use the bin icon.&#x20;

<figure><img src="https://1781349671-files.gitbook.io/~/files/v0/b/gitbook-x-prod.appspot.com/o/spaces%2FKyXRCFh0c08ryiUFvyMV%2Fuploads%2F81tYFOP41upCftQPbWu9%2Fimage.png?alt=media&amp;token=8d6dacbd-6524-4a95-a00c-71b2c45be113" alt=""><figcaption><p>Delete a criteria</p></figcaption></figure>

6. Click **Create.**&#x20;

<figure><img src="https://1781349671-files.gitbook.io/~/files/v0/b/gitbook-x-prod.appspot.com/o/spaces%2FKyXRCFh0c08ryiUFvyMV%2Fuploads%2FooYAD0Z5V7jWvW7HYN8l%2Fimage.png?alt=media&amp;token=eee1aaa5-b714-4b2d-b4b1-a38d1d984a26" alt=""><figcaption><p>Click 'Create'</p></figcaption></figure>

7. You can now find the rule added to the list of rules. You can add more rules by selecting **Add Rule.**

<figure><img src="https://1781349671-files.gitbook.io/~/files/v0/b/gitbook-x-prod.appspot.com/o/spaces%2FKyXRCFh0c08ryiUFvyMV%2Fuploads%2Fa0DYYy5BpjMOpAdDVNhv%2Fimage.png?alt=media&amp;token=404e1a94-024a-4f30-b95b-3a91f395c5c3" alt=""><figcaption><p>To add more rules</p></figcaption></figure>

8. **Default Approver**: In the final step, add one or more default approvers who will approve the changes that do not meet the above-configured rules/criteria. Click **Save**, and you are good to go.

<figure><img src="https://1781349671-files.gitbook.io/~/files/v0/b/gitbook-x-prod.appspot.com/o/spaces%2FKyXRCFh0c08ryiUFvyMV%2Fuploads%2F8ali1h2HIJVknle5qLwu%2Fimage.png?alt=media&amp;token=216f8891-607b-4dba-8034-8a4e9e4921bd" alt=""><figcaption><p>Approver for other changes that do not meet these rules</p></figcaption></figure>


# Approval using a Lookup Table

### Get the approver details **from a Lookup Table**

In this method, you can select the approvers based on rules, by looking up data from another table.

<figure><img src="https://1781349671-files.gitbook.io/~/files/v0/b/gitbook-x-prod.appspot.com/o/spaces%2FKyXRCFh0c08ryiUFvyMV%2Fuploads%2Fay9FyMj4as3EqEnG9CJO%2Fimage.png?alt=media&amp;token=6ffbe706-ae71-419c-b320-e02a59434eb3" alt=""><figcaption><p>Users that meet rules from a lookup table</p></figcaption></figure>

&#x20;The options are explained below:

* **Lookup Table**: This dropdown menu displays a list of tables in the connection. Select the table from which the approvers list is to be looked up/fetched.
* **Column Containing Approvers**: Choose the column containing the approvers' email IDs.

<figure><img src="https://1781349671-files.gitbook.io/~/files/v0/b/gitbook-x-prod.appspot.com/o/spaces%2FKyXRCFh0c08ryiUFvyMV%2Fuploads%2FR9G52ESWv9SSdjqBySDn%2Fimage.png?alt=media&amp;token=f0886324-c902-4c52-b675-83b48ab493aa" alt=""><figcaption><p>Lookup table details</p></figcaption></figure>

The next step is to map the matching columns from the lookup table to their corresponding columns in the source table to join the tables.

* **Source Table Column to apply filter:** Select the column from the source table that is also present in  the lookup table.
* **Matching Lookup Table Column:** Map the matching column from the lookup table.
* You can set multiple conditions (join multiple shared columns) as needed, by clicking on **Add Condition.**

<figure><img src="https://1781349671-files.gitbook.io/~/files/v0/b/gitbook-x-prod.appspot.com/o/spaces%2FKyXRCFh0c08ryiUFvyMV%2Fuploads%2F4BVk9eMGmRvBShO5UQH8%2Fimage.png?alt=media&amp;token=50f9aaae-e3fd-4c04-a0b4-8501276b75b1" alt=""><figcaption><p>Filter conditions</p></figcaption></figure>

In the above example, each subcategory in the lookup table has a person-in-change with their Email IDs added in the 'Approvers' column. By mapping the subcategory name columns from both tables, we allow the approvers' email IDs to be fetched for each subcategory.&#x20;

* **Default Approvers**: Specify the default approvers to approve changes that do not involve the above-set conditions (subcategories with no approver details). Click **Save.**

<figure><img src="https://1781349671-files.gitbook.io/~/files/v0/b/gitbook-x-prod.appspot.com/o/spaces%2FKyXRCFh0c08ryiUFvyMV%2Fuploads%2FuVUIY08xTYSrENbVo0eL%2Fimage.png?alt=media&amp;token=4d603ccf-32d6-4f60-8959-6820895a0c88" alt=""><figcaption><p>Default approvers</p></figcaption></figure>

* Click on **Preview Rules** to view the approvers list for each subcategory.&#x20;
* You can use the **Sync Rules** option to sync the connected lookup table to fetch the latest data. The last sync details and the status can also be seen.


# Multi-level Approvals

Multi-level approvals require a change request to go through multiple levels of review before it is finally approved, ensuring compliance, oversight, and better decision-making. Each level corresponds to a different approver who reviews and approves the request at that level.&#x20;

You can create up to three levels of approval using PowerTable.

Let us look at the steps to enable multi-level approvals.

1. Enable multi-level approvals by toggling on the highlighted button.
2. Configure the required number of approval levels.
3. Enter the name of the approvers for each level.
4. Click **Save.**

<figure><img src="https://1781349671-files.gitbook.io/~/files/v0/b/gitbook-x-prod.appspot.com/o/spaces%2FKyXRCFh0c08ryiUFvyMV%2Fuploads%2FcTrJpsEQuqXocJ0WPZcM%2Fimage.png?alt=media&amp;token=08118ab1-04ca-4d86-a189-002a8a660928" alt=""><figcaption><p>Set multi-level approval</p></figcaption></figure>


# Setting Additional Notification via MS Teams

By default, approvers are notified through emails about the change requests. Optionally, you can also use Microsoft Teams channels to notify the approvers.

1. Click **Add Channel** to add a Microsoft Teams channel.

<figure><img src="https://1781349671-files.gitbook.io/~/files/v0/b/gitbook-x-prod.appspot.com/o/spaces%2FKyXRCFh0c08ryiUFvyMV%2Fuploads%2Fz5P5lFfu8JdA46emaKcD%2Fimage.png?alt=media&amp;token=9d959841-ef70-47fb-8d11-89883635434b" alt=""><figcaption><p>Add Channel</p></figcaption></figure>

2. Configure the channel and webhook details as shown below:

<figure><img src="https://1781349671-files.gitbook.io/~/files/v0/b/gitbook-x-prod.appspot.com/o/spaces%2FKyXRCFh0c08ryiUFvyMV%2Fuploads%2FY95pv4hJ7HpKr5gRgLUe%2Fimage.png?alt=media&amp;token=ddc70294-8233-4152-b9a6-0a3695610d5d" alt=""><figcaption><p>Configure channel and webhook</p></figcaption></figure>

3. Click **Save** to add the channel. Change requests will now be communicated to the approvers through email as well as this channel.

<figure><img src="https://1781349671-files.gitbook.io/~/files/v0/b/gitbook-x-prod.appspot.com/o/spaces%2FKyXRCFh0c08ryiUFvyMV%2Fuploads%2FuT6aeTgnqh9u46AnfkoO%2Fimage.png?alt=media&amp;token=241a869c-f9a0-446e-be24-60f61c49c632" alt=""><figcaption><p>MS Teams notification to approvers</p></figcaption></figure>


# Handling Changes Before Approval

In this section, you can specify your preferences for saving changes to the databases, when an approval workflow is in place. There are two options available.

## **1. Only after approval**

In this method, the changes are saved to the database only after approval. This is the default mode.

<figure><img src="https://1781349671-files.gitbook.io/~/files/v0/b/gitbook-x-prod.appspot.com/o/spaces%2FKyXRCFh0c08ryiUFvyMV%2Fuploads%2FNhcSYKedRHcwiz3CvZ8S%2Fimage.png?alt=media&amp;token=079f8315-a920-4b90-95f6-1f8ac19103f1" alt=""><figcaption><p>Save changes only after approval</p></figcaption></figure>

After making changes, click **Submit for Review.**

<figure><img src="https://1781349671-files.gitbook.io/~/files/v0/b/gitbook-x-prod.appspot.com/o/spaces%2FKyXRCFh0c08ryiUFvyMV%2Fuploads%2FvhzYCPqNqCkEuZMvYObS%2Fimage.png?alt=media&amp;token=695a50d7-1698-421a-bb65-9c98f574b8a0" alt=""><figcaption><p>Submit for Review</p></figcaption></figure>

This opens the pop-up below, where you can add the description, due date for approval and priority of the change. Click **Submit** to send them to the approver.

<figure><img src="https://1781349671-files.gitbook.io/~/files/v0/b/gitbook-x-prod.appspot.com/o/spaces%2FKyXRCFh0c08ryiUFvyMV%2Fuploads%2FP6RxjEpu7my6FEKhRIvc%2Fimage.png?alt=media&amp;token=68cee144-fd18-4e45-a7b2-5c62fc274c41" alt=""><figcaption><p>Add description, due date and priority</p></figcaption></figure>

## **2. Save with Pending Approval Status**

In this option, the changes are saved and synced to the database with a 'Pending Approval' status flag.&#x20;

The rows marked as pending are sent for review. Once approved, the status column will be updated to reflect the 'Approved' flag, and the data will also be updated accordingly.

<figure><img src="https://1781349671-files.gitbook.io/~/files/v0/b/gitbook-x-prod.appspot.com/o/spaces%2FKyXRCFh0c08ryiUFvyMV%2Fuploads%2FP6EsqfpR6RSqRJnO6chy%2Fimage.png?alt=media&amp;token=a18ec66e-8681-4847-8188-d3e18c1c7af7" alt=""><figcaption><p>Save immediately with 'pending' status</p></figcaption></figure>

1. Choose any existing column from the table to reflect the status flag field. We have used the column 'Status' in the example below, where the status is recorded.
2. Enter the required text to be displayed for each state, such as 'pending review', 'approved', and 'rejected'.&#x20;
3. Click **Save.**

After making the changes to the table, click **Submit for Review**. This saves the data along with its status.

The saved changes are displayed with the label, 'Pending'. Approved and rejected changes are displayed with the labels, 'Approved' and 'Rejected' respectively.

<figure><img src="https://1781349671-files.gitbook.io/~/files/v0/b/gitbook-x-prod.appspot.com/o/spaces%2FKyXRCFh0c08ryiUFvyMV%2Fuploads%2FIGmBDDvqQFYGuvg1IXNe%2Fimage.png?alt=media&amp;token=0781c2ab-80c9-4199-b4a6-e578239ff5be" alt=""><figcaption><p>Saved changes</p></figcaption></figure>


# Review Changes - Approval process

In this section, we will discuss the approval workflow process from both the author's and the approver's ends. The author is the user who has requested changes, and the approver is the user who approves them.&#x20;

Let us assume the author has made a few changes and has sent them for approval.&#x20;

<figure><img src="https://1781349671-files.gitbook.io/~/files/v0/b/gitbook-x-prod.appspot.com/o/spaces%2FKyXRCFh0c08ryiUFvyMV%2Fuploads%2FFrNybwmfqlNsakGqUEwy%2Fimage.png?alt=media&amp;token=a7d2eb68-65de-4ed3-937a-c2db6dc60f21" alt=""><figcaption><p>Submit for Review</p></figcaption></figure>

Now we will go to the **Approvals** tab where we can find the outline as well as detailed information on the change requests.&#x20;

<figure><img src="https://1781349671-files.gitbook.io/~/files/v0/b/gitbook-x-prod.appspot.com/o/spaces%2FKyXRCFh0c08ryiUFvyMV%2Fuploads%2FhY7Y7jI1Gc8g0bYAGtwK%2Fimage.png?alt=media&amp;token=05896089-74f4-4485-aa84-eedf1a09b612" alt=""><figcaption><p>Approvals tab</p></figcaption></figure>

It has two sections: **Pending Requests** (requests you need to approve) and **My Requests** (requests raised by you).

<figure><img src="https://1781349671-files.gitbook.io/~/files/v0/b/gitbook-x-prod.appspot.com/o/spaces%2FKyXRCFh0c08ryiUFvyMV%2Fuploads%2Fl9G3leeGEwuLHcsrngxz%2Fimage.png?alt=media&amp;token=bbbb12ed-8b72-4eb6-bd4b-625d83f9a212" alt=""><figcaption><p>Requests raised </p></figcaption></figure>

{% hint style="info" %}
In certain situations, a user may serve as both an approver and an author, depending on the set rules for specific sections or departments. In this case, the user can easily switch between tabs to view their pending approval requests as well as the requests they have submitted.
{% endhint %}

Let us start with the 'My Requests' tab.

## 1. 'My Requests' screen

This tab displays an overview of the requests and changes you have made and sent to the approver.

<figure><img src="https://1781349671-files.gitbook.io/~/files/v0/b/gitbook-x-prod.appspot.com/o/spaces%2FKyXRCFh0c08ryiUFvyMV%2Fuploads%2Fl9G3leeGEwuLHcsrngxz%2Fimage.png?alt=media&amp;token=bbbb12ed-8b72-4eb6-bd4b-625d83f9a212" alt=""><figcaption><p>'My Requests' screen</p></figcaption></figure>

This screen has the following sections:

* **Pending Review:** This tab lists all your open requests that are yet to be reviewed and approved.
* **Overdue:** This tab displays your open requests that have crossed their due date for approval.
* **Action Required:** This tab displays any adjustments/suggestions made by the approver for the user to act on.
* **Closed:** This tab displays requests that have been approved or closed.

You can switch between these tabs. Once the requests are approved/closed, they will be moved to the 'Closed' section.

**Search:** This window has a search box that helps you search for specific requests.

<figure><img src="https://1781349671-files.gitbook.io/~/files/v0/b/gitbook-x-prod.appspot.com/o/spaces%2FKyXRCFh0c08ryiUFvyMV%2Fuploads%2Fc5dqUWSF5GUoJft7asuf%2Fimage.png?alt=media&amp;token=d35f912c-8501-4ff6-a249-c47d9453e06f" alt=""><figcaption><p>Search box</p></figcaption></figure>

## 2. Detailed view of your request

The 'My Request' screen provides an overview of all change requests submitted. To understand each change request in detail, you can click on **Details.**

<figure><img src="https://1781349671-files.gitbook.io/~/files/v0/b/gitbook-x-prod.appspot.com/o/spaces%2FKyXRCFh0c08ryiUFvyMV%2Fuploads%2F6JnoQAM0YACcdZUVvZ9p%2Fimage.png?alt=media&amp;token=ee96e14e-eb27-4623-8567-b404b2d9ca84" alt=""><figcaption><p>Click on 'Details'</p></figcaption></figure>

It includes the request ID, description (if you have added one), approver information, the date and time it was raised, who raised it, whether it is a high priority, the due date for approval, and its status.

* Click on **Edit Details** to change any of these details.

<figure><img src="https://1781349671-files.gitbook.io/~/files/v0/b/gitbook-x-prod.appspot.com/o/spaces%2FKyXRCFh0c08ryiUFvyMV%2Fuploads%2FY2CzX9Uq4PsLO7c4TWZp%2Fimage.png?alt=media&amp;token=932e8fef-978c-4478-b2d1-61f176f39827" alt=""><figcaption><p>Request details</p></figcaption></figure>

It also offers a number of options, including editing data, adding comments, viewing history, closing the request, and re-submitting it for review.&#x20;

<figure><img src="https://1781349671-files.gitbook.io/~/files/v0/b/gitbook-x-prod.appspot.com/o/spaces%2FKyXRCFh0c08ryiUFvyMV%2Fuploads%2Fz1QzjsId6BAj4Pg9WgHL%2Fimage.png?alt=media&amp;token=6cedacb6-27ee-4b45-995a-76a6a3650a3c" alt=""><figcaption><p>Options available in the 'My Requests' tab</p></figcaption></figure>

### 2.1. Add or View Comments

It has a 'View Comments' option that lets you view existing comments and also add new comments to the changes so that approvers can understand them better. This works similarly to the [commenting and collaboration](/explore-powertable/collaborative-commenting) feature.

1. Click on the cell to which you want to add the comment. The comment icon is enabled.

<figure><img src="https://1781349671-files.gitbook.io/~/files/v0/b/gitbook-x-prod.appspot.com/o/spaces%2FKyXRCFh0c08ryiUFvyMV%2Fuploads%2FHakLiBtugDgYEmphT72Y%2Fimage.png?alt=media&amp;token=e9a7aa55-1b11-4c23-87da-d98e19461141" alt=""><figcaption><p>Comment icon</p></figcaption></figure>

2. Click on it to add a comment and then pos&#x74;**.** The comments are updated automatically and approvers can view them when they open the requests.

<figure><img src="https://1781349671-files.gitbook.io/~/files/v0/b/gitbook-x-prod.appspot.com/o/spaces%2FKyXRCFh0c08ryiUFvyMV%2Fuploads%2FsWLKhKPvYdYrAA44AzZW%2Fimage.png?alt=media&amp;token=ccfaa223-1b2b-4c79-ae8c-e55bdef13c7e" alt=""><figcaption><p>Adding a comment to the change</p></figcaption></figure>

3. You can also add assignees and start a comment thread. To add assignees, click on **Assign to user** and select the assignee, or you can directly use an @mention and add their names in the comments.

<figure><img src="https://1781349671-files.gitbook.io/~/files/v0/b/gitbook-x-prod.appspot.com/o/spaces%2FKyXRCFh0c08ryiUFvyMV%2Fuploads%2FBWyJcMh4Nw8sXgwGDkfy%2Fimage.png?alt=media&amp;token=4daed2f1-deb4-4784-aee5-deadaef044cd" alt=""><figcaption><p>Assign task to user</p></figcaption></figure>

<figure><img src="https://1781349671-files.gitbook.io/~/files/v0/b/gitbook-x-prod.appspot.com/o/spaces%2FKyXRCFh0c08ryiUFvyMV%2Fuploads%2FYqyHHbPcqw2R7GgqtT4c%2Fimage.png?alt=media&amp;token=880b313b-fff5-450b-b2d3-da9b3d240eac" alt=""><figcaption><p>Using @mention</p></figcaption></figure>

The task status is automatically set to 'Open' and an email notification is sent to them. The assignees can reply to the thread to start a conversation.

4. Click on **View Comments** to view all the added comments.

<figure><img src="https://1781349671-files.gitbook.io/~/files/v0/b/gitbook-x-prod.appspot.com/o/spaces%2FKyXRCFh0c08ryiUFvyMV%2Fuploads%2FHHCArUy8JN2QJEOFV6CR%2Fimage.png?alt=media&amp;token=b53a9a8b-83c8-4027-a198-540ffc812809" alt=""><figcaption><p>View Comments</p></figcaption></figure>

### 2.2. Edit

1. To edit the data in the submitted changes, click on the **Edit** option. The changes can be a new one or the undoing/modification of the existing ones.

<figure><img src="https://1781349671-files.gitbook.io/~/files/v0/b/gitbook-x-prod.appspot.com/o/spaces%2FKyXRCFh0c08ryiUFvyMV%2Fuploads%2FBY68gpSiDtFqdGwJDR01%2Fimage.png?alt=media&amp;token=c0f0ac8e-66d8-4f5e-a2d9-3e7dfb298e9f" alt=""><figcaption></figcaption></figure>

&#x20;2\. After editing, click **Save.** The saved changes are submitted automatically.

<figure><img src="https://1781349671-files.gitbook.io/~/files/v0/b/gitbook-x-prod.appspot.com/o/spaces%2FKyXRCFh0c08ryiUFvyMV%2Fuploads%2FBnAjZpjp91NNkftfECxp%2Fimage.png?alt=media&amp;token=662473fe-dc6d-4172-8742-5cb5d90ec01a" alt=""><figcaption><p>Save changes</p></figcaption></figure>

### 2.3. View History

Click on **View** **History** to view the history of edits or user actions.

### 2.4. Close Request

Use the **Close Request** option to pull back the submitted request and move it from the 'Open' to the 'Closed' section.

<figure><img src="https://1781349671-files.gitbook.io/~/files/v0/b/gitbook-x-prod.appspot.com/o/spaces%2FKyXRCFh0c08ryiUFvyMV%2Fuploads%2Fbor0y3vdRA0bumgUEjvR%2Fimage.png?alt=media&amp;token=6cd5234f-16ce-4361-b30f-8e479a2b0a9f" alt=""><figcaption><p>Close Request</p></figcaption></figure>

### 2.5. Re-Submit For Review

If the approver has requested changes during their review, you can either make the suggested changes or choose to skip them while adding a comment. Once you have made the necessary changes or added your comment, click the **Re-submit for Review** button to resubmit your work.

<figure><img src="https://1781349671-files.gitbook.io/~/files/v0/b/gitbook-x-prod.appspot.com/o/spaces%2FKyXRCFh0c08ryiUFvyMV%2Fuploads%2Fp1yR8HhuzEeeCi8lTCAS%2Fimage.png?alt=media&amp;token=8d856172-3887-4079-84f5-67133a29d946" alt=""><figcaption><p>Re-submit for Review</p></figcaption></figure>

## 3. 'Pending Requests' window

This tab shows all the pending changes that require your review and approval. If you are an approver, you can view the requests submitted by other users in this section.&#x20;

Similar to the 'My requests' tab, this window has options to **search** for specific requests.

## 4. Detailed view of a pending request

Click on the **Details** option for any request to access the detailed information.

The approver can access this window to view detailed changes in a single request. They can view the changes, which are highlighted in blue, and deleted rows in red as below:

1. To approve a change, select it and click **Approve.**
2. To reject a change, select it and click **Reject.**
3. To request/suggest changes, click **Request Changes.** The steps are explained [here](#id-5.-request-changes-or-adjustments).
4. Click on **View Comments** to view added comments.
5. Select **History** to view the history of actions performed.

## 5. Request Changes or Adjustments

The approver can suggest modifications by requesting changes. In response, the author can review these suggestions, make the necessary adjustments, and then resubmit the revised request for further consideration.&#x20;

1. If you are an approver, you can request changes to the author by clicking **Request Changes.**
2. You can optionally add comments describing the suggestion. Comments help the author understand the modifications you need. Click **Submit.**
3. The author is notified through email. They can make the changes and [resubmit it for review](#id-2.5.-re-submit-for-review).

Both the author and the approver are notified through emails about the suggested changes and the resubmission, facilitating quicker and easier collaboration through a simple conversation thread.

## 6. Removing Approval Workflow

To disable the approvals, click on the **Manage Approvals** tab and toggle off the Enable Approvals button, and click **Proceed.**&#x20;

<figure><img src="https://1781349671-files.gitbook.io/~/files/v0/b/gitbook-x-prod.appspot.com/o/spaces%2FKyXRCFh0c08ryiUFvyMV%2Fuploads%2FPzD2kWum8HNOEAZUVP73%2Fimage.png?alt=media&amp;token=b8989a31-d0b1-467b-830e-2cb7a900173b" alt=""><figcaption></figcaption></figure>

{% hint style="info" %}
When approval flow is disabled, all active requests are deleted, and any new changes to the table can be committed directly by clicking on **Save**.
{% endhint %}


# Automation

When working with data in a collaborative environment, it is necessary to notify team members and stakeholders about changes to the data. Additionally, it is important to propagate these updates to related and dependent tables to maintain data consistency and integrity.

PowerTable can automate these types of repetitive workflows by integrating with necessary applications based on defined actions and conditions.

You can create automated workflows that execute one or more predefined actions in response to specific triggers. Choose when your automation should run by defining triggers, and then add one or more actions with required customizations to define what happens next—all without the need for coding.

## 1. Understanding automation workflows

An automation workflow consists of a **trigger** and **one or more actions** that follow it.

<figure><img src="https://1781349671-files.gitbook.io/~/files/v0/b/gitbook-x-prod.appspot.com/o/spaces%2FKyXRCFh0c08ryiUFvyMV%2Fuploads%2FbK4ky3eNjDHwLxChcSnh%2Fimage.png?alt=media&amp;token=4a336bfd-eef7-4ca3-bef1-980e655ce7a6" alt="" width="375"><figcaption><p>Automation flow</p></figcaption></figure>

Triggers can be any event, such as data updates, row insertion or deletion, a configured time schedule, a form submission, or a click of a button.

<figure><img src="https://1781349671-files.gitbook.io/~/files/v0/b/gitbook-x-prod.appspot.com/o/spaces%2FKyXRCFh0c08ryiUFvyMV%2Fuploads%2FXIAczkkL3PxDJSJrphcB%2Fimage.png?alt=media&amp;token=14da1cbf-0806-4b40-9f96-6e0f1521dbfa" alt="" width="375"><figcaption><p>Triggers </p></figcaption></figure>

The actions that you can define include:

* Sending real-time notifications to the stakeholders about the data changes across different channels (email, Microsoft Teams message, webhooks) to keep them informed.&#x20;
* Cascading the data changes across all related and dependent tables consistently.

<figure><img src="https://1781349671-files.gitbook.io/~/files/v0/b/gitbook-x-prod.appspot.com/o/spaces%2FKyXRCFh0c08ryiUFvyMV%2Fuploads%2Fj24E5mHUUYqAZstBxNic%2Fimage.png?alt=media&amp;token=fc75ba1b-510d-4c84-b9fa-6379ad09bea1" alt="" width="305"><figcaption><p>Actions</p></figcaption></figure>

PowerTable can automate such repetitive workflows by executing these predefined actions based on triggers (events or data changes).

## 2. Setting up a Workflow

Setting up an automation workflow involves the following steps:

1. **Create an Automation Workflow:** Create a new automation workflow to configure the trigger and action(s).
2. **Define the Trigger:** Configure the events or data changes that will trigger your workflow. E.g., a new record is created in the table, an existing record is updated or deleted, etc. You can also add one or more conditions to the trigger event to make it more specific.
3. **Choose Actions:** Select the actions you want to perform in response to the event. E.g., create a new row in another table, send an email or Microsoft Teams notification, post the update through webhooks, etc.

When an event occurs, PowerTable can automatically:

* **Send Notifications**: Trigger email or MS Teams notifications to keep stakeholders informed.
* **Trigger Webhooks**: Integrate with external systems by sending real-time data updates.
* **Perform Cascaded Updates**: Apply changes across related records to maintain data consistency.

The upcoming sections in the guide provide an overview of how to configure and manage automated workflows in your environment.


# Send Mail notifications

PowerTable can send email notifications to relevant stakeholders whenever an event or data change occurs.

1. Select **Setup > Automations.**

<figure><img src="https://1781349671-files.gitbook.io/~/files/v0/b/gitbook-x-prod.appspot.com/o/spaces%2FKyXRCFh0c08ryiUFvyMV%2Fuploads%2FbpcuXHLQOe98C0kayGE7%2Fimage.png?alt=media&amp;token=55273077-15f0-40af-babf-0e349fb7e1e7" alt=""><figcaption><p>Setup automation</p></figcaption></figure>

2. Create a new automation workflow by clicking on **Create**, as shown below.

<figure><img src="https://1781349671-files.gitbook.io/~/files/v0/b/gitbook-x-prod.appspot.com/o/spaces%2FKyXRCFh0c08ryiUFvyMV%2Fuploads%2FdvIK6Crqu3t5JuMBoT5n%2Fimage.png?alt=media&amp;token=30aa549b-aa4b-4a3a-b733-19fd75ddadbe" alt=""><figcaption><p>Create Automation</p></figcaption></figure>

3. Click **Add Trigger** or directly select any of the suggested triggers to configure the triggering event.

<figure><img src="https://1781349671-files.gitbook.io/~/files/v0/b/gitbook-x-prod.appspot.com/o/spaces%2FKyXRCFh0c08ryiUFvyMV%2Fuploads%2Fhoe4BK4Xv3sOmTWGKoq1%2Fimage.png?alt=media&amp;token=e9d8206d-957b-4e71-af96-080526340689" alt=""><figcaption><p>Add Trigger</p></figcaption></figure>

4. Let us assume you need to notify your team members whenever a new record is created. In this case, you can select the trigger, 'When a record is created'. A trigger event is added.

<figure><img src="https://1781349671-files.gitbook.io/~/files/v0/b/gitbook-x-prod.appspot.com/o/spaces%2FKyXRCFh0c08ryiUFvyMV%2Fuploads%2FPuu4JQQIBefUtUwinf79%2Fimage.png?alt=media&amp;token=2b631c86-916b-4874-8786-5b7915b5e9a1" alt=""><figcaption><p>Trigger added</p></figcaption></figure>

5. You can define additional properties and add conditions to further customize your trigger and make it more specific.&#x20;

In the image below, we have added a trigger description and a condition for the trigger that specifies a particular category.&#x20;

<figure><img src="https://1781349671-files.gitbook.io/~/files/v0/b/gitbook-x-prod.appspot.com/o/spaces%2FKyXRCFh0c08ryiUFvyMV%2Fuploads%2FkAIYChcc6f7iqvBjxbH9%2Fimage.png?alt=media&amp;token=b1eba65c-e07f-4c89-a222-62511e4c6467" alt=""><figcaption><p>Add conditions</p></figcaption></figure>

{% hint style="info" %}
You can add multiple conditions and combine them using AND/OR, for an event to initiate the action.
{% endhint %}

6. Click **Add action** and then choose **Send Email** to send an email notification whenever the event occurs.

<figure><img src="https://1781349671-files.gitbook.io/~/files/v0/b/gitbook-x-prod.appspot.com/o/spaces%2FKyXRCFh0c08ryiUFvyMV%2Fuploads%2FAjxdEsVZDYNgZkgEvHVS%2Fimage.png?alt=media&amp;token=c92fffbd-25b4-4c72-837f-ac3fc805427b" alt=""><figcaption><p>Send Email</p></figcaption></figure>

7. Enter the action description, the email addresses of the members to be notified, the subject, and the body of the email. Finally, click **Save Changes**.

<figure><img src="https://1781349671-files.gitbook.io/~/files/v0/b/gitbook-x-prod.appspot.com/o/spaces%2FKyXRCFh0c08ryiUFvyMV%2Fuploads%2FZr0RPzVX8ThRaourm5zY%2Fimage.png?alt=media&amp;token=5ef5abba-f714-4fc2-9240-193c762179fe" alt=""><figcaption><p>Define action</p></figcaption></figure>

8. The automation workflow is now set up successfully. You can use the pencil icon to name this workflow for easier identification. You can also add more actions to this event, such as triggering a webhook or cascading updates.

<figure><img src="https://1781349671-files.gitbook.io/~/files/v0/b/gitbook-x-prod.appspot.com/o/spaces%2FKyXRCFh0c08ryiUFvyMV%2Fuploads%2FzHGhrMPFvCYwg6vPe3Gf%2Fimage.png?alt=media&amp;token=1570f16b-be0f-4df4-9108-58eade63b00c" alt=""><figcaption><p>Workflow automated</p></figcaption></figure>


# MS Teams notifications

Send notifications across Microsoft Teams channels whenever an event or data change occurs.

1. Select **Setup > Automations.**

<figure><img src="https://1781349671-files.gitbook.io/~/files/v0/b/gitbook-x-prod.appspot.com/o/spaces%2FKyXRCFh0c08ryiUFvyMV%2Fuploads%2FbpcuXHLQOe98C0kayGE7%2Fimage.png?alt=media&amp;token=55273077-15f0-40af-babf-0e349fb7e1e7" alt=""><figcaption><p>Setup automation</p></figcaption></figure>

2. Create a new automation workflow by clicking on **Create.**

<figure><img src="https://1781349671-files.gitbook.io/~/files/v0/b/gitbook-x-prod.appspot.com/o/spaces%2FKyXRCFh0c08ryiUFvyMV%2Fuploads%2FacsKKHUFNJP6pgRu4JHg%2Fimage.png?alt=media&amp;token=0bf78eec-21d1-4870-90c9-d93ec3d2657f" alt=""><figcaption><p>Create Automation</p></figcaption></figure>

3. Click **Add Trigger** or directly select any of the suggested triggers to configure the triggering event.

<figure><img src="https://1781349671-files.gitbook.io/~/files/v0/b/gitbook-x-prod.appspot.com/o/spaces%2FKyXRCFh0c08ryiUFvyMV%2Fuploads%2FGIhgBFZEWeGakoyHtJIK%2Fimage.png?alt=media&amp;token=c320e677-ac6d-4305-9f2f-27481753bc67" alt=""><figcaption><p>Add Trigger</p></figcaption></figure>

4. Let us assume you need to notify your team members whenever a new record is created. In this case, you can select the trigger, 'When a record is created'. A trigger event is added.

<figure><img src="https://1781349671-files.gitbook.io/~/files/v0/b/gitbook-x-prod.appspot.com/o/spaces%2FKyXRCFh0c08ryiUFvyMV%2Fuploads%2FPuu4JQQIBefUtUwinf79%2Fimage.png?alt=media&amp;token=2b631c86-916b-4874-8786-5b7915b5e9a1" alt=""><figcaption><p>Trigger added</p></figcaption></figure>

5. You can define additional properties and add conditions to further customize your trigger and make it more specific.&#x20;

In the image below, we have added a trigger description and a condition for the trigger that specifies a particular category.&#x20;

{% hint style="info" %}
You can add multiple conditions and combine them using AND/OR, for an event to initiate the action.
{% endhint %}

<figure><img src="https://1781349671-files.gitbook.io/~/files/v0/b/gitbook-x-prod.appspot.com/o/spaces%2FKyXRCFh0c08ryiUFvyMV%2Fuploads%2FwtlTxQCbjebooAdwLcvT%2Fimage.png?alt=media&amp;token=0959219c-19af-4c2b-9abd-b284a2b553b1" alt=""><figcaption><p>Add conditions</p></figcaption></figure>

6. Click **Add action** and then choose **Microsoft Teams Message** to send a Teams message whenever the event occurs.

<figure><img src="https://1781349671-files.gitbook.io/~/files/v0/b/gitbook-x-prod.appspot.com/o/spaces%2FKyXRCFh0c08ryiUFvyMV%2Fuploads%2F7y5mo01mjLi87QITQRpf%2Fimage.png?alt=media&amp;token=40f69e01-3da5-4faa-97fa-422ff4d0e6d6" alt=""><figcaption><p>Send MS Teams message</p></figcaption></figure>

7. Enter the action description and the message to be sent. Then, configure the respective Teams Channels as shown below. Finally, click **Save Changes**.

<figure><img src="https://1781349671-files.gitbook.io/~/files/v0/b/gitbook-x-prod.appspot.com/o/spaces%2FKyXRCFh0c08ryiUFvyMV%2Fuploads%2FilIeF8ZPYcIW7T0aZAkz%2Fimage.png?alt=media&amp;token=1e5f365d-7d61-42e7-85c5-818cd9276503" alt=""><figcaption><p>Define action</p></figcaption></figure>

8. The automation workflow is now set up successfully. You can use the pencil icon to name this workflow for easier identification. You can also add more actions to this event such as sending an email or cascading updates.

<figure><img src="https://1781349671-files.gitbook.io/~/files/v0/b/gitbook-x-prod.appspot.com/o/spaces%2FKyXRCFh0c08ryiUFvyMV%2Fuploads%2FiOcrTj4D19s119FpDo9s%2Fimage.png?alt=media&amp;token=7f4e3a27-8688-42b3-ad0f-828ed8691bbe" alt=""><figcaption><p>Workflow automated</p></figcaption></figure>


# Webhooks

PowerTable also supports adding a webhook URL to post the event or data changes.

Any changes made to the table by users, which includes CRUD operations like insert, update, and delete, can be instantly posted from PowerTable to a specific endpoint. You can also schedule regular notifications.

{% hint style="info" %}
Triggering webhooks involves the same initial steps as sending an email or an MS Teams message. Follow steps 1 through 5 from the [previous section](/explore-powertable/automation/ms-teams-notifications) to create an automation and add a trigger.
{% endhint %}

1. Click **Add action** and then choose **Trigger Webhook.**

<figure><img src="https://1781349671-files.gitbook.io/~/files/v0/b/gitbook-x-prod.appspot.com/o/spaces%2FKyXRCFh0c08ryiUFvyMV%2Fuploads%2FpuEOh4UQAAvKb9zzhUlj%2Fimage.png?alt=media&amp;token=a8a0a683-9ce3-4d70-a585-aa144060a3ab" alt=""><figcaption><p>Trigger webhook</p></figcaption></figure>

2. Configure the webhook by adding the webhook URL and authentication details as shown below. Click **Save Changes.**

<figure><img src="https://1781349671-files.gitbook.io/~/files/v0/b/gitbook-x-prod.appspot.com/o/spaces%2FKyXRCFh0c08ryiUFvyMV%2Fuploads%2FtG3JAi0MhlJJx2zb7QRJ%2Fimage.png?alt=media&amp;token=844a3e27-7b36-4cef-87f8-104f3f8de443" alt=""><figcaption><p>Configure webhook</p></figcaption></figure>

3. The automation workflow is now set up successfully. You can use the pencil icon to name this workflow for easier identification. You can also add more actions to this event, such as sending an email or cascading updates.

<figure><img src="https://1781349671-files.gitbook.io/~/files/v0/b/gitbook-x-prod.appspot.com/o/spaces%2FKyXRCFh0c08ryiUFvyMV%2Fuploads%2FX4klwatlbiRi3M4U365I%2Fimage.png?alt=media&amp;token=e6d111f1-af46-4904-995e-a98e0e9336df" alt=""><figcaption><p>Workflow automated</p></figcaption></figure>


# Cascade Updates

When updating a database, it is essential to also update all related and dependent records to maintain data consistency, accuracy, and integrity.&#x20;

PowerTable allows you to automatically cascade updates across all related tables using an automation workflow.

1. Select **Setup > Automations.**

<figure><img src="https://docs.powertable.com/~gitbook/image?url=https%3A%2F%2F1781349671-files.gitbook.io%2F%7E%2Ffiles%2Fv0%2Fb%2Fgitbook-x-prod.appspot.com%2Fo%2Fspaces%252FKyXRCFh0c08ryiUFvyMV%252Fuploads%252FbpcuXHLQOe98C0kayGE7%252Fimage.png%3Falt%3Dmedia%26token%3D55273077-15f0-40af-babf-0e349fb7e1e7&#x26;width=768&#x26;dpr=4&#x26;quality=100&#x26;sign=306f75e2&#x26;sv=2" alt=""><figcaption><p>Setup automation</p></figcaption></figure>

2. Create a new automation workflow by clicking on **Create.**

<figure><img src="https://docs.powertable.com/~gitbook/image?url=https%3A%2F%2F1781349671-files.gitbook.io%2F%7E%2Ffiles%2Fv0%2Fb%2Fgitbook-x-prod.appspot.com%2Fo%2Fspaces%252FKyXRCFh0c08ryiUFvyMV%252Fuploads%252FacsKKHUFNJP6pgRu4JHg%252Fimage.png%3Falt%3Dmedia%26token%3D0bf78eec-21d1-4870-90c9-d93ec3d2657f&#x26;width=768&#x26;dpr=4&#x26;quality=100&#x26;sign=163211d9&#x26;sv=2" alt=""><figcaption><p>Create Automation</p></figcaption></figure>

3. Click **Add Trigger** or directly select any of the suggested triggers to configure the triggering event.

<figure><img src="https://docs.powertable.com/~gitbook/image?url=https%3A%2F%2F1781349671-files.gitbook.io%2F%7E%2Ffiles%2Fv0%2Fb%2Fgitbook-x-prod.appspot.com%2Fo%2Fspaces%252FKyXRCFh0c08ryiUFvyMV%252Fuploads%252FGIhgBFZEWeGakoyHtJIK%252Fimage.png%3Falt%3Dmedia%26token%3Dc320e677-ac6d-4305-9f2f-27481753bc67&#x26;width=768&#x26;dpr=4&#x26;quality=100&#x26;sign=efc68397&#x26;sv=2" alt=""><figcaption><p>Add Trigger</p></figcaption></figure>

4. Let us assume you need to update relevant records in another table whenever a new record is created. In this case, you can select the trigger, 'When a record is created'. A trigger event is added.

<figure><img src="https://docs.powertable.com/~gitbook/image?url=https%3A%2F%2F1781349671-files.gitbook.io%2F%7E%2Ffiles%2Fv0%2Fb%2Fgitbook-x-prod.appspot.com%2Fo%2Fspaces%252FKyXRCFh0c08ryiUFvyMV%252Fuploads%252FPuu4JQQIBefUtUwinf79%252Fimage.png%3Falt%3Dmedia%26token%3D2b631c86-916b-4874-8786-5b7915b5e9a1&#x26;width=768&#x26;dpr=4&#x26;quality=100&#x26;sign=927015de&#x26;sv=2" alt=""><figcaption><p>Trigger event added</p></figcaption></figure>

5. You can define additional properties and add conditions to further customize your trigger and make it more specific.

{% hint style="info" %}
You can add multiple conditions and combine them using AND/OR, for an event to initiate the action.
{% endhint %}

6. Click **Add action** and then choose the required database action that you want to perform. Let's update a record in another table whenever a new record is created in the current table.

<figure><img src="https://1781349671-files.gitbook.io/~/files/v0/b/gitbook-x-prod.appspot.com/o/spaces%2FKyXRCFh0c08ryiUFvyMV%2Fuploads%2FIS1z7rGb8lWuwITyYlCX%2Fimage.png?alt=media&amp;token=1d491f3c-5477-4d56-91c0-c6de9bc42d7c" alt=""><figcaption><p>Update record in another table</p></figcaption></figure>

7. Add the connection information, schema, and table name for the table you want to update simultaneously. You can specify any conditions, such as updating only certain records in the table.

<figure><img src="https://1781349671-files.gitbook.io/~/files/v0/b/gitbook-x-prod.appspot.com/o/spaces%2FKyXRCFh0c08ryiUFvyMV%2Fuploads%2FlloGQ0B8brCr8p4vG9Dg%2Fimage.png?alt=media&amp;token=6109e92e-7a21-4e2a-97da-b162ae4c5266" alt=""><figcaption><p>Update table details and conditions to update</p></figcaption></figure>

8. Add the required row values to be updated in the table.

<figure><img src="https://1781349671-files.gitbook.io/~/files/v0/b/gitbook-x-prod.appspot.com/o/spaces%2FKyXRCFh0c08ryiUFvyMV%2Fuploads%2FaW4TyahksegRUVlXCy5h%2Fimage.png?alt=media&amp;token=b01c657e-ef11-447b-9e9e-a2a88be544c0" alt=""><figcaption><p>Add row values</p></figcaption></figure>

9. Click **Save Changes** after configuring the row values.

<figure><img src="https://1781349671-files.gitbook.io/~/files/v0/b/gitbook-x-prod.appspot.com/o/spaces%2FKyXRCFh0c08ryiUFvyMV%2Fuploads%2FwffRDd8bfrPKCXYrT2gt%2Fimage.png?alt=media&amp;token=c30bc278-7b86-41da-88c9-316c398216bd" alt=""><figcaption><p>Save configuration</p></figcaption></figure>

10. The automation workflow is now set up successfully. You can use the pencil icon to name this workflow for easier identification. You can also add more actions to this cascading update event, such as sending an email or a Microsoft Teams message.

<figure><img src="https://1781349671-files.gitbook.io/~/files/v0/b/gitbook-x-prod.appspot.com/o/spaces%2FKyXRCFh0c08ryiUFvyMV%2Fuploads%2FvRLXhH6DYHoGszF4jDgp%2Fimage.png?alt=media&amp;token=fff33754-92dc-49f8-a982-50cab273cd62" alt=""><figcaption><p>Workflow automated</p></figcaption></figure>


# Pause an Automation

After creating automations, you can pause the required workflows without deleting them. This allows you to enable or disable one or more workflows as needed, saving you from having to start over if you need them again.

To pause or resume an automation, simply click the toggle button next to it.

<figure><img src="https://1781349671-files.gitbook.io/~/files/v0/b/gitbook-x-prod.appspot.com/o/spaces%2FKyXRCFh0c08ryiUFvyMV%2Fuploads%2FCo3F09ZAwxCrBt2oybWo%2Fimage.png?alt=media&amp;token=17e11531-f1ab-4553-9e2e-a22da58c100a" alt=""><figcaption><p>Pause an automation</p></figcaption></figure>

To delete an automation, click the three-dot menu next to its name in the list and select **Delete**.

<figure><img src="https://1781349671-files.gitbook.io/~/files/v0/b/gitbook-x-prod.appspot.com/o/spaces%2FKyXRCFh0c08ryiUFvyMV%2Fuploads%2F0AF5TwKcve35PVIZd9bQ%2Fimage.png?alt=media&amp;token=bfc82948-6525-4639-a351-0ce88c60aa37" alt=""><figcaption><p>Delete automation</p></figcaption></figure>


# Webhooks

PowerTable allows you to instantly send transaction results to a specific URL endpoint. This is accomplished by including a webhook URL in your PowerTable app.

The transaction logs contain information about any database changes made by users using PowerTable, including CRUD operations such as Insert, Update, and Delete. It displays detailed information about the transactions, such as the transaction type, number of rows affected by the transaction, status and duration of the transaction, the person who initiated them, etc.

You can view the transaction logs from the PowerTable console, as detailed in [this section](/explore-powertable/powertable-console/transaction-logs).

If you want PowerTable to immediately send these transaction logs as notifications to a specific endpoint, you can set up a webhook as explained below:

* Click on **Setup >** **Table** **Settings > Webhook** to access this window.

<figure><img src="https://1781349671-files.gitbook.io/~/files/v0/b/gitbook-x-prod.appspot.com/o/spaces%2FKyXRCFh0c08ryiUFvyMV%2Fuploads%2F8RuXSXO1jZOW1VT3XQ8g%2Fimage.png?alt=media&amp;token=368e0712-e893-415a-96b6-70b5a2445c62" alt=""><figcaption><p>Webhook</p></figcaption></figure>

* Enter the endpoint's URL in the 'Post URL' text box.
* You can also add your required request header by clicking on **Add New Header** and entering the key-value pair.

<figure><img src="https://1781349671-files.gitbook.io/~/files/v0/b/gitbook-x-prod.appspot.com/o/spaces%2FKyXRCFh0c08ryiUFvyMV%2Fuploads%2FxpfJXNV9bnMpMLtashs3%2Fimage.png?alt=media&amp;token=acd37036-34e6-4e26-82bc-709992a7d26f" alt=""><figcaption><p>Request header</p></figcaption></figure>


# Type 2 SCDs

Type 2 Slowly Changing Dimension (SCD) is a data warehousing method used to track changes in data over time by preserving the change history. You can view the historical data for each record and their corresponding time range when it was valid.

### 1. Understanding Type 2 SCDs

* Whenever an entity's data in any dimension changes, a new row is created instead of overwriting the old ones.
* Each new row includes the updated information along with the start date and end date that indicate the validity period of the updated information.
* There is an additional flag column that indicates the record that is currently active. This column can be of the checkbox type or a simple true/false or 0/1 column.
* There can be one or more timestamp columns in addition to the start date to signify when a new record was actually created or when the change was made effective.

This approach allows us to analyze the historical data and understand how the information has evolved over time.

### 2. Example for Type 2 SCDs

Let us consider an employee database where the employees' details, such as salary, incentive, job role, etc., can slowly change over time.

With SCDs, whenever there is a change, a new row with the updated details is created instead of overwriting the old one. This new row includes an effective start date that indicates when it was updated or when the new details became live.

Meanwhile, the old row will have an end date marking when it was last valid. Likewise, every change made to an employee is tracked through a series of rows, each with its respective start and end dates.

Find below the database where SCDs are in place:

<table data-full-width="false"><thead><tr><th width="155" align="center">ID (Surrogate Key)</th><th width="129" align="center">Emp.ID (Business Key)</th><th width="119" align="center">Employee Name</th><th width="91" data-type="number">Salary</th><th width="147">RowValidFrom</th><th width="142">RowValidTo</th></tr></thead><tbody><tr><td align="center">1</td><td align="center"><mark style="color:green;"><strong>C501</strong></mark></td><td align="center"><mark style="color:green;"><strong>John S</strong></mark></td><td>70000</td><td>20-10-2023</td><td>23-10-2024</td></tr><tr><td align="center">56</td><td align="center">C002</td><td align="center">Alan B</td><td>75000</td><td>01-01-2024</td><td>31-12-2025</td></tr><tr><td align="center">234</td><td align="center"><mark style="color:green;"><strong>C501</strong></mark></td><td align="center"><mark style="color:green;"><strong>John S</strong></mark></td><td>80000</td><td>24-10-2024</td><td>31-12-2025</td></tr><tr><td align="center">235</td><td align="center">C988</td><td align="center">Lily S</td><td>65000</td><td>21-10-2024</td><td>31-12-2025</td></tr></tbody></table>

One table row represents an entity's attributes for a defined timespan. The whole lifespan of one business entity can be inferred from a list of such rows.

In the next section, we will discuss how to configure a database that can support SCDs and how you can assign the appropriate keys in PowerTable.


# Configuring Type 2 SCDs in PowerTable

Type 2 SCDs can be optionally added in your PowerTable app to track changes in your database. Before enabling Type 2 SCDs, please note that they can be configured for specific tables that have the necessary fields. In this section, we will go over how to configure them from start to finish.

### 1. Configuring the Database

To set up SCDs, the source table must contain a few specific column types to enable and support them. After adding them, we can configure the columns and the appropriate keys in the PowerTable app. In this section, we will look at all of these steps in detail.

We will use the below table to demonstrate the implementation of Type 2 SCDs in PowerTable:

<figure><img src="https://608526116-files.gitbook.io/~/files/v0/b/gitbook-x-prod.appspot.com/o/spaces%2FdpYgiTFFEktmDlcxUGTv%2Fuploads%2FsUFen3EsnezxqhtMNWpU%2Fimage.png?alt=media&#x26;token=03180783-ec84-471d-85b7-b76de779561a" alt=""><figcaption><p>Sample Table</p></figcaption></figure>

{% hint style="info" %}
The *ID\_New* column is assigned in the **Primary Keys** field, while other columns are assigned to the **Columns** field, in the Visualizations pane.
{% endhint %}

To configure SCDs, your table must contain the highlighted columns as shown below. The Future/Effective date column is optional.

<figure><img src="https://608526116-files.gitbook.io/~/files/v0/b/gitbook-x-prod.appspot.com/o/spaces%2FdpYgiTFFEktmDlcxUGTv%2Fuploads%2FjkXdS0A5LaNfeAZiGO8L%2Fimage.png?alt=media&#x26;token=bc65af51-e4e7-4774-8eb1-744490dc0d6a" alt=""><figcaption><p>Sample database in EDITable</p></figcaption></figure>

These are explained below in detail.

### 2. Key Terms used in Type 2 SCD implementation

Let's revisit some of the key terms used while configuring SCDs.

Every row in the table would have a business key and a surrogate key.

#### 3.1. Business Key

1. The business key/natural key is an entity's unique identifier. In the above example, each employee can be viewed as an entity identified by a unique ID (*Employee ID*) known as the business key.
2. It must be unique to an entity, mandatory, and non-null.
3. It is an attribute of the entity derived from the data.

As shown in the above example, your table should have a numeric/text/alphanumeric column that can be used as a business key and meets all of the above requirements.

#### 3.2. Surrogate Key

* The surrogate key is a system-generated key and identifies each unique record in the table.
* Unlike business keys, surrogate keys are not derived from data and are not attributes of entities.
* A surrogate key is automatically incremented by one whenever a new record is created to track the change.

By default, PowerTable selects the primary key as the surrogate key. Therefore, the table must include a numeric data type column that has a unique value for each record. This column should be assigned to the 'Primary Keys' field in the Visualizations pane so that EDITable can automatically detect it as the surrogate key.

{% hint style="info" %}
It’s important to note that while an entity's business key can be identical or non-unique across rows in the table, the surrogate key must be unique for each row.
{% endhint %}

#### 3.3. Start Date

This date indicates the day when the updated information became active or when changes were made to the table.

#### 3.4. End Date

This date represents the last day until that row's information is valid.

#### 3.5. Active Flag

This is an additional flag column to signify the record that is currently active. This column uses a simple indicator (0/1 or true/false) to denote whether a specific record is presently active or a valid version.

The table should contain a VARCHAR/text type column for setting up an active flag column with the default value 'true' set for all rows. You can then configure this column in the 'Manage Columns' window with the checkbox type.

#### 3.6. Future Date/Effective Date

EDITable lets you add an effective date/timestamp column alongside the start date column to record when the change actually took effect. To do this, create another date column in your table and then choose it from the 'Future Dates' dropdown menu.

{% hint style="info" %}

* The **Start Date** indicates when the record was added/updated and became valid in the system (operational perspective).
* The **Effective Date** represents the actual date when the change took effect in the real world (business perspective).
* These two dates are usually the same in most cases, but they can differ due to internal policies, business rules, delays in data entry, processing, etc.

Adding the Effective Date allows you to query historical data based on when the change was valid in the business context, not the system context. This enables accurate tracking that can be helpful for reporting, compliance audits, and ensuring downstream systems use the correct business timeline.
{% endhint %}

### 3. Configuring the Columns

After configuring the source table as explained above, we have to ensure the columns are assigned the appropriate properties to support Type 2 SCDs. This is done in step 2, in the 'Manage Columns' window, after loading your table and configuring the source.

<figure><img src="https://608526116-files.gitbook.io/~/files/v0/b/gitbook-x-prod.appspot.com/o/spaces%2FdpYgiTFFEktmDlcxUGTv%2Fuploads%2FwSmQzkwmAgQo8wBnI4gT%2Fimage.png?alt=media&#x26;token=d45418c8-1b9c-40a1-9d90-bbf43f21e595" alt=""><figcaption><p>Manage Columns</p></figcaption></figure>

Best practices for configuring the columns in the PowerTable visual:

* Ensure that the surrogate key is assigned as the primary key in the Visualizations pane.
* Enable the 'Required' option for the above fields so that these are always available.
* Disable 'Allow Edits' for the surrogate key to avoid accidentally editing it. This ensures that each surrogate key is distinct and helps to identify the row.
* Ensure to choose appropriate 'Input Type' for the columns (Date type for Start Date, Effective Date and End Date, Check box type for Active Flag column, etc.).

<figure><img src="https://608526116-files.gitbook.io/~/files/v0/b/gitbook-x-prod.appspot.com/o/spaces%2FdpYgiTFFEktmDlcxUGTv%2Fuploads%2FvbqYEk6litSPOAJBc3CW%2Fimage.png?alt=media&#x26;token=1eff9d50-efa3-4bac-b42d-dd807285025c" alt=""><figcaption><p>Configuring the columns</p></figcaption></figure>

* After configuring the columns, click **Save** to save the configuration.

{% hint style="info" %}
You can always return to this window and reconfigure the columns if necessary by selecting the **Manage Columns** option in the Home tab.
{% endhint %}

The next step is to enable Type 2 SCDs.

### 4. Enabling Type 2 SCD support

In the next step, you can enable Type 2 SCDs.

1. Click on the link as shown in the image below:

<figure><img src="https://608526116-files.gitbook.io/~/files/v0/b/gitbook-x-prod.appspot.com/o/spaces%2FdpYgiTFFEktmDlcxUGTv%2Fuploads%2FCgihw2T7lpnq7urjyTXu%2Fimage.png?alt=media&#x26;token=d2a23154-44a4-44a4-9c2b-98c99d9f64af" alt=""><figcaption><p>Click to configure SCDs</p></figcaption></figure>

2. Enable support for SCDs using the toggle button as shown below and start configuring them.

<figure><img src="https://608526116-files.gitbook.io/~/files/v0/b/gitbook-x-prod.appspot.com/o/spaces%2FdpYgiTFFEktmDlcxUGTv%2Fuploads%2FPauFbes03cW1ZhrwuOU7%2Fimage.png?alt=media&#x26;token=e09fcdc8-959b-4c2b-a0ae-a28679d22df2" alt=""><figcaption><p>Enable support for SCDs</p></figcaption></figure>

### 5. Configuring SCDs

Now that we have created a table with all of the necessary fields and how to use them, we will begin adding them to the pop-up window, as shown below:

<figure><img src="https://608526116-files.gitbook.io/~/files/v0/b/gitbook-x-prod.appspot.com/o/spaces%2FdpYgiTFFEktmDlcxUGTv%2Fuploads%2FffFo8iOaM9tQASbVmaFt%2Fimage.png?alt=media&#x26;token=a86855e3-eb4b-4fce-b91c-385380153b27" alt=""><figcaption><p>Configuring SCDs</p></figcaption></figure>

Click on **Save** to save the choices. **Close Settings** to return to the table.

<figure><img src="https://608526116-files.gitbook.io/~/files/v0/b/gitbook-x-prod.appspot.com/o/spaces%2FdpYgiTFFEktmDlcxUGTv%2Fuploads%2Fa2DXCMnI4EHsoeH8mH4D%2Fimage.png?alt=media&#x26;token=6067099e-d341-4ccf-8933-89d2c74c1add" alt="" width="563"><figcaption><p>Click 'Save'</p></figcaption></figure>

The table now looks as shown below with all active records.

<figure><img src="https://608526116-files.gitbook.io/~/files/v0/b/gitbook-x-prod.appspot.com/o/spaces%2FdpYgiTFFEktmDlcxUGTv%2Fuploads%2FljyWcwc79qCRq0jdSlnd%2Fimage.png?alt=media&#x26;token=545a2874-edb7-482d-8a69-b6b69a81422d" alt=""><figcaption><p>After configuring SCDs</p></figcaption></figure>

### 6. Accessing Row History

Let's assume a few records in the table have been edited. To view the change history of the record, you need to follow the steps below:

1. **Select the record**: Choose the record you are interested in.
2. **View History**: Once you select the record, click on **History** to view its history. This history includes all the changes that have been made to the record over time.

<figure><img src="https://608526116-files.gitbook.io/~/files/v0/b/gitbook-x-prod.appspot.com/o/spaces%2FdpYgiTFFEktmDlcxUGTv%2Fuploads%2F4ltOdzysIfmA44ZTFUFy%2Fimage.png?alt=media&#x26;token=65b9a284-5573-4755-a32a-2c57b15465e4" alt=""><figcaption><p>View history of a record</p></figcaption></figure>

3. **Most Recent First**: The changes are displayed in order, with the most recent changes at the top. This way, you can quickly see the latest updates first. The history of the particular record is shown below:

<figure><img src="https://608526116-files.gitbook.io/~/files/v0/b/gitbook-x-prod.appspot.com/o/spaces%2FdpYgiTFFEktmDlcxUGTv%2Fuploads%2F5o59Jszp666B5MYwpPi2%2Fimage.png?alt=media&#x26;token=9d923e9f-c52a-473b-b928-0934b8f56fdc" alt=""><figcaption><p>History of the record</p></figcaption></figure>

{% hint style="info" %}
At a time, you will be able to view the history of a **single row.**
{% endhint %}

This way, you can set up Type 2 SCDs for your database.

{% hint style="warning" %}
Note:

1. The action of configuring SCDs is permanent and cannot be undone once enabled and saved.
2. If you have missed configuring SCDs and wish to set it on a later date or you need to edit the existing configuration, you will need to **reset** all the visual settings by clicking on **Reset** in the **Settings** window. Note that this resets all the settings, including the source and column configurations.
   {% endhint %}

<figure><img src="https://608526116-files.gitbook.io/~/files/v0/b/gitbook-x-prod.appspot.com/o/spaces%2FdpYgiTFFEktmDlcxUGTv%2Fuploads%2F7rXdivaacujGw0ojCbTV%2Fimage.png?alt=media&#x26;token=0432ea26-5866-4b86-8205-9c8a78e5a14b" alt=""><figcaption><p>Reset</p></figcaption></figure>

* To reset the SCD configurations, or to enable SCDs at a later date, you need to click on **Reset.**
* To view the existing SCD configuration, you can go to **Settings -> Slowly Changing Dimensions.**

<figure><img src="https://608526116-files.gitbook.io/~/files/v0/b/gitbook-x-prod.appspot.com/o/spaces%2FdpYgiTFFEktmDlcxUGTv%2Fuploads%2F38pTZDIzU76fbc3JFHH6%2Fimage.png?alt=media&#x26;token=88b63114-201d-44a7-97bd-3c6d4d8ab9ff" alt=""><figcaption><p>View SCD configuration</p></figcaption></figure>

{% hint style="info" %}
The following features are not supported if you have enabled Type 2 SCDs for your table:

* Soft delete
* Audit log
* Persistence mode in approval workflows
  {% endhint %}


# Forms

Forms allow you to collect data directly from users and input it into your database. This section explains how to collect user data using forms and store it in your PowerTable app.&#x20;

Forms are a versatile tool that can be used for various purposes, such as capturing expense reports, collecting user responses, running polls and quizzes, gathering customer feedback, and more. You can use them for tasks like surveying, registering event attendees, managing internal requests, and onboarding new users. They make data collection easier and optimize workflows for both individuals and businesses with their structured format and customizable fields.

## 1. Create a Form

1. Go to **Setup > Forms.**

<figure><img src="https://1781349671-files.gitbook.io/~/files/v0/b/gitbook-x-prod.appspot.com/o/spaces%2FKyXRCFh0c08ryiUFvyMV%2Fuploads%2F5q93bHNjHz6XET5Di2gw%2Fimage.png?alt=media&amp;token=50f023d5-6dba-4b0f-b463-e5b0ad7261f6" alt=""><figcaption><p>Click on 'Form'</p></figcaption></figure>

2. Click on **Create a Form.**&#x20;

<figure><img src="https://1781349671-files.gitbook.io/~/files/v0/b/gitbook-x-prod.appspot.com/o/spaces%2FKyXRCFh0c08ryiUFvyMV%2Fuploads%2FGELFj84yBsDdrA4ytWRf%2Fimage.png?alt=media&amp;token=1b492ca1-03bc-4602-af2b-58bce74f73a7" alt=""><figcaption><p>Create a Form</p></figcaption></figure>

You'll see a window where you can configure the required fields for your form and customize them.

<figure><img src="https://1781349671-files.gitbook.io/~/files/v0/b/gitbook-x-prod.appspot.com/o/spaces%2FKyXRCFh0c08ryiUFvyMV%2Fuploads%2FfOnW2I6Y8OAXGiJyaMnl%2Fimage.png?alt=media&amp;token=92816dc5-0868-4cf2-b228-5ba7574454cd" alt=""><figcaption><p>Form configuration</p></figcaption></figure>

The primary key field is automatically added to the form since it is mandatory. You can start adding other required fields to your form.

<figure><img src="https://1781349671-files.gitbook.io/~/files/v0/b/gitbook-x-prod.appspot.com/o/spaces%2FKyXRCFh0c08ryiUFvyMV%2Fuploads%2F2KmaGLAySd30KbN76qsV%2Fimage.png?alt=media&amp;token=b37fb94a-a3db-4097-bb81-3404e2626b1d" alt=""><figcaption><p>Primary Key field</p></figcaption></figure>

## 2. Add New Fields

1. Hover your mouse down the primary key field and click the '+' icon to begin adding new fields below.

<figure><img src="https://1781349671-files.gitbook.io/~/files/v0/b/gitbook-x-prod.appspot.com/o/spaces%2FKyXRCFh0c08ryiUFvyMV%2Fuploads%2FzaMmqDA9me3HDH4HLfcQ%2Fimage.png?alt=media&amp;token=ad4f920b-a537-4d16-b930-2005cff89f12" alt=""><figcaption><p>Click to add field below</p></figcaption></figure>

2. Select the required fields from the dropdown list or click 'Select All' to select all the table fields to add to the form.

<figure><img src="https://1781349671-files.gitbook.io/~/files/v0/b/gitbook-x-prod.appspot.com/o/spaces%2FKyXRCFh0c08ryiUFvyMV%2Fuploads%2Fo2jkdK9V410x1znq2XqX%2Fimage.png?alt=media&amp;token=3bcfe9f1-ccca-4874-bb75-3d162a627f3e" alt=""><figcaption><p>Adding fields</p></figcaption></figure>

3. You can also add more fields later by clicking the '+' icon directly below any previously added field.

<figure><img src="https://1781349671-files.gitbook.io/~/files/v0/b/gitbook-x-prod.appspot.com/o/spaces%2FKyXRCFh0c08ryiUFvyMV%2Fuploads%2FfpQs5ktEVV9IWXLL0DDN%2Fimage.png?alt=media&amp;token=6a04edad-bc68-4a34-b7c4-100d5a030d0b" alt=""><figcaption><p>Adding more fields</p></figcaption></figure>

## 3. Create Field Groups

To make user inputs more readable and organized, you can group related or similar fields together. In address blocks, for example, you can group related fields such as house number, street name, city, state, zip code, and so on.&#x20;

Grouped fields also enable you to perform bulk operations on fields, such as hiding them or formatting them at once.

1. Click on **Add Group** to create a new group.

<figure><img src="https://1781349671-files.gitbook.io/~/files/v0/b/gitbook-x-prod.appspot.com/o/spaces%2FKyXRCFh0c08ryiUFvyMV%2Fuploads%2Fqhg1b31MPrirFzxSMJHL%2Fimage.png?alt=media&amp;token=f8bd6415-e9f8-4e7a-9bf0-9a00ef60c024" alt=""><figcaption><p>Add Group</p></figcaption></figure>

2. A new field group is created, within which you can begin adding fields.
3. When adding a new field, click the '+' icon on either side of the existing field to group it together.

<figure><img src="https://1781349671-files.gitbook.io/~/files/v0/b/gitbook-x-prod.appspot.com/o/spaces%2FKyXRCFh0c08ryiUFvyMV%2Fuploads%2FXW7D59HuVpYQeH40zSkL%2Fimage.png?alt=media&amp;token=c828cd66-68d9-411b-8efe-0a21728a96d2" alt=""><figcaption><p>Adding fields to the left or right</p></figcaption></figure>

<figure><img src="https://1781349671-files.gitbook.io/~/files/v0/b/gitbook-x-prod.appspot.com/o/spaces%2FKyXRCFh0c08ryiUFvyMV%2Fuploads%2FrYNrIJb9670aUS4WenVe%2Fimage.png?alt=media&amp;token=887fd46c-5a51-4d01-b067-09d4719d2d09" alt=""><figcaption><p>Adding field to the left</p></figcaption></figure>

You can specify which fields are mandatory and which are optional.

After configuring all the required fields in the form, click **Save.** Your form is now created.


# Audit logs

The audit log is a comprehensive record of all changes made to the table. PowerTable's audit log is interactive and offers both search and filter options. It also allows you to download and export the logs.

This section provides information on how to access audit logs and other related features.

## 1. Track Changes

Click on the **Audit** tab to open the audit logs window.&#x20;

<figure><img src="https://1781349671-files.gitbook.io/~/files/v0/b/gitbook-x-prod.appspot.com/o/spaces%2FKyXRCFh0c08ryiUFvyMV%2Fuploads%2FZF12new304UxZwVBrRCz%2Fimage.png?alt=media&amp;token=7bb2a24b-f82c-4cc9-be09-adb52de6b6fd" alt=""><figcaption><p>Audit tab</p></figcaption></figure>

The audit log displays detailed information about recent changes and updates to your table, keeping track of all modifications. The changes are classified into different tabs—Data, Access, etc.—based on the type of change.

#### Data

The **Data** tab provides a chronological record of transactions and actions to track all data changes in the source table, as shown in the image below.&#x20;

<figure><img src="https://1781349671-files.gitbook.io/~/files/v0/b/gitbook-x-prod.appspot.com/o/spaces%2FKyXRCFh0c08ryiUFvyMV%2Fuploads%2FDkY9wcTJNisgvmTHLcbj%2Fimage.png?alt=media&amp;token=41c45f5a-fe7a-4150-bab0-c578555dbe71" alt=""><figcaption><p>Data changes</p></figcaption></figure>

This log includes the row ID of the modified record, details of the modified columns, the previous and new values, the person who made the change, the date and time of the change, and the type of modification.&#x20;

{% hint style="info" %}
The audit log captures all the significant actions performed on the table, including Insert, Update, Delete, and Soft Delete.
{% endhint %}

#### Access

The Access tab keeps track of any changes to row and column access permissions, including who made the changes and when they were made.

<figure><img src="https://1781349671-files.gitbook.io/~/files/v0/b/gitbook-x-prod.appspot.com/o/spaces%2FKyXRCFh0c08ryiUFvyMV%2Fuploads%2FMk6tLwSVskX1Ts2BKtt2%2Fimage.png?alt=media&amp;token=9077da1d-08b8-48e2-92ac-ed42af56a715" alt=""><figcaption><p>Access changes</p></figcaption></figure>

Similarly, the **Settings** tab lists all changes to table settings and so on.

## 2. Search and Filter

You can use the 'Search' and 'Filter' options to look for specific changes made to a specific record.

<figure><img src="https://1781349671-files.gitbook.io/~/files/v0/b/gitbook-x-prod.appspot.com/o/spaces%2FKyXRCFh0c08ryiUFvyMV%2Fuploads%2FP5KXC324y7YvSBwgGUgm%2Fimage.png?alt=media&amp;token=120b437a-dd9a-48e7-bbd9-25c3f4baff87" alt=""><figcaption><p>Search and filter</p></figcaption></figure>

The options available are as follows:

1. **Search Row ID -** Enter the Row ID in this search box to search and track all changes made to a specific row. Based on the row ID, the logs are dynamically filtered and displayed.
2. **Action -** You can filter records by their type of change, such as inserted, updated with a new value, deleted, or soft-deleted.
3. **Approved By -** When an approval system is in place, you can use this option to filter changes based on who approved them. [This section](broken://pages/TKIqzng0msYl6vYq23R7) contains more information about the approval workflow.
4. **Modified By -** Use this filter to see changes made by specific members of your team.
5. **Last 30 Days -** Use this filter to see changes made within the last 30 days or in a specific date range.
6. **Reset All -** Select this option to remove all applied filters.

## **3. Export Logs**

The **Download Logs** option allows you to download and export audit logs to Excel or CSV files or email them.

<figure><img src="https://1781349671-files.gitbook.io/~/files/v0/b/gitbook-x-prod.appspot.com/o/spaces%2FKyXRCFh0c08ryiUFvyMV%2Fuploads%2FhEfVU5KP0BwfMFFlOdGO%2Fimage.png?alt=media&amp;token=cf760d48-5511-4af9-842b-e28019333c0d" alt=""><figcaption><p>Download as Excel file</p></figcaption></figure>

<figure><img src="https://1781349671-files.gitbook.io/~/files/v0/b/gitbook-x-prod.appspot.com/o/spaces%2FKyXRCFh0c08ryiUFvyMV%2Fuploads%2FatyJ3mYjAvp6KLH685iU%2Fimage.png?alt=media&amp;token=f36d852f-6655-498a-bd9d-a04e5e92c1d2" alt=""><figcaption><p>Send the logs to email</p></figcaption></figure>


# Collaborative Commenting

Data-level commentary is commonly used in real-life scenarios. PowerTable allows you to add comments to individual cells, rows, and columns in a table to provide context to your data, collaborate with your team by tagging them, and assign tasks. All of these features are available without the need for any coding.

Here are the key highlights of the commentary solution provided by PowerTable:

* Add comments and annotations to individual cells, rows, and columns.
* Add a dedicated comment column to add row-level comments.
* Tag users and stakeholders using @mention and reply to others' comments.
* Tagged members are notified through an email instantly with the relevant link to take action at a data point level.
* Assign tasks and collaborate with your team, especially for workflow use cases.
* Using the commentary audit log, track tasks and audit the entire list of comments, including details like who wrote them, what they wrote, and when (date and time).
* Comments are always associated with a specific data point, row, or column, so when the data is filtered, the comment appears at the appropriate location.

The comments feature is located at the top of the toolbar, near your user profile.

## **1. Add New Comment**

You can add formatted data-level comments, which are saved securely to the database, along with details such as author and time stamp.

1. Select a cell/column where you want to add a comment. Then click on **Comments.**

<figure><img src="https://1781349671-files.gitbook.io/~/files/v0/b/gitbook-x-prod.appspot.com/o/spaces%2FKyXRCFh0c08ryiUFvyMV%2Fuploads%2FvT7jOJ7HJRWFqmUXtVlJ%2Fimage.png?alt=media&amp;token=3e93ff8e-1c30-44d0-a5e2-b6118afff050" alt=""><figcaption><p>Add comment</p></figcaption></figure>

2. You can also click the **Add New Comment** option from the dropdown to add a new comment.

<figure><img src="https://1781349671-files.gitbook.io/~/files/v0/b/gitbook-x-prod.appspot.com/o/spaces%2FKyXRCFh0c08ryiUFvyMV%2Fuploads%2FNxl09yhF7XRzHggJ9V74%2Fimage.png?alt=media&amp;token=1cd2fae9-e242-48f5-a748-3c71e183290e" alt=""><figcaption><p>Add a new comment</p></figcaption></figure>

3. The comments editor opens up. Enter a comment and click on the highlighted icon.

<figure><img src="https://1781349671-files.gitbook.io/~/files/v0/b/gitbook-x-prod.appspot.com/o/spaces%2FKyXRCFh0c08ryiUFvyMV%2Fuploads%2FkMgVuMJ74a6NAeQHOPJT%2Fimage.png?alt=media&amp;token=0caf44eb-7e94-4726-8989-b0269a26e719" alt=""><figcaption><p>Post the comment</p></figcaption></figure>

4. The comment gets posted. You can see a green indicator on the top right corner of the cell. Hovering over it reveals the comment that has been added.

<figure><img src="https://1781349671-files.gitbook.io/~/files/v0/b/gitbook-x-prod.appspot.com/o/spaces%2FKyXRCFh0c08ryiUFvyMV%2Fuploads%2FTFkzGXUNk1CIxO0dE4Oe%2Fimage.png?alt=media&amp;token=c5356cd4-f941-42f2-8777-d352833c96f5" alt=""><figcaption><p>Comment posted</p></figcaption></figure>

## **2. Edit a Comment**

To edit a comment, hover over the cell containing the comment and click on the pencil icon. You can then start editing the comment.

<figure><img src="https://1781349671-files.gitbook.io/~/files/v0/b/gitbook-x-prod.appspot.com/o/spaces%2FKyXRCFh0c08ryiUFvyMV%2Fuploads%2FKctPD8H4a2KqO3IUrn4X%2Fimage.png?alt=media&amp;token=5c66c0cd-8a4e-4163-bd08-9715c7c8218d" alt=""><figcaption><p>Edit comment</p></figcaption></figure>

## 3. Delete a Comment

To delete a comment thread, click on the bin icon.

<figure><img src="https://1781349671-files.gitbook.io/~/files/v0/b/gitbook-x-prod.appspot.com/o/spaces%2FKyXRCFh0c08ryiUFvyMV%2Fuploads%2FxsjfzRrV2veOKfL2Smo0%2Fimage.png?alt=media&amp;token=36bf049a-8334-403a-810f-faa04328eea6" alt=""><figcaption><p>Delete comment</p></figcaption></figure>

## **4.** Mention other users

You can use the @ symbol to tag other stakeholders and draw their attention​.

1. Click on a cell and then choose **Add a comment**. Type @ in the comment editor. You will see a list of the users in the workspace.
2. Select the desired user, add the comment, and click **Post.**
3. The comment gets posted successfully.

## 5. Reply to a Comment

To reply to a comment, simply click on the comment and choose **Reply**. The comment reply gets added as a thread, and the number of replies is shown along with the comment.

## **6. Comments Column**

You can add a dedicated comments column to capture row-level comments.

1. In the 'Comments' dropdown, turn the **Comments column** toggle on. The comments column gets added.
2. Click on any cell in the comments column. The comment editor opens. Enter a comment and click **Post**.
3. The comment gets added as shown in the below image.
4. To reply to a comment in the comments column, simply click on the comment and then select **Reply.**
5. The number of replies is also shown along with the comment.
6. To hide the comments column, turn off the toggle.

## **7. Hide All Comments**

To hide comments temporarily, turn on the **Hide All Comments** toggle.

## 8. Email Notifications

The ‘@user’ [mention](#id-4.-mention-other-users) in the comment automatically sends an email notification to the user with a link to the report so that the user can respond to this comment and update the data if required. Replies to the comments are also notified to the user instantly.

1. Email notifications on comment replies can be turned off. In the dropdown highlighted, click on **Profile Settings**. In the side panel, turn off the toggle.
2. Email notifications for new replies or mentions can be turned off. In the **Settings** panel, uncheck the highlighted checkbox.

[This section](/explore-powertable/collaborative-commenting/comment-settings) covers all of the other options in the comments settings panel in detail.

In the next section, we'll see how you can assign & track tasks.


# Comment Settings

Inforiver offers a variety of comment-related settings, including the ability to set up commentary access rules for users, lock/unlock threads, enable/disable notifications, and more.

1. Click on **Settings** in the 'Comments' dropdown.

A side panel opens with a list of options as below.

Let's take a detailed look at these options.

## 1. Enable Comments

1. By default, comments are enabled. To disable commenting, uncheck the highlighted checkbox and click **Save**.
2. You would no longer be able to add comments.

## 2. Show Comments Panel

Check the highlighted checkbox to open the comments panel by default when you open the report.

## 3. Commentary Access

By default, all users within the domain can add comments. However, if you want only specific users to be able to comment, select the highlighted option. A new field gets enabled where you can add the users.

## 4. Lock/Unlock Threads

Locked threads cannot be edited, deleted, or replied to by any user. To do any of the above, the user must first unlock it. Using the option as shown below, you can allow only specific users to lock and unlock threads by specifying their email IDs.

## **5. Email notifications**

To disable email notifications for new mentions or replies, uncheck the highlighted checkbox in the **Settings** panel.

## 6. Report Name

You can modify the report name that appears in email notifications, as indicated below.

## 7. Delete all comments

To delete all comments in the report permanently, click on **Delete all comments**.&#x20;

## 8. Reset all settings

Changes made in the settings panel can be reset using the **Reset all settings** option.

<figure><img src="https://content.gitbook.com/content/KyXRCFh0c08ryiUFvyMV/blobs/trfIqJxmkdEiKJRuxTgb/image.png" alt=""><figcaption><p>Reset all settings</p></figcaption></figure>


# View all comments & track changes

Tracking the report changes using an interactive, filterable, and comment-enabled audit log ensures data governance. Our audit log captures date, time, user details, task status, and other information. There is a separate comments log that shows who commented on a specific data point and when.

1. To view all comments and tasks, click on the 'Comments' dropdown and choose **View All Comments.**&#x20;
2. The side panel categorizes comments at the header and cell levels. You can see all the details here, such as the header name or cell ID where the comment is added, the names of the assignor and assignee, task status, thread replies, timestamp when they were added, and so on.
3. Click on the required cell ID or the header name to locate the comment.
4. **Filter comments:** Comments and tasks can be filtered by assignee, assignor, status, and time period. Choose 'Resolved' to view all resolved threads, 'My threads' to view discussions started by you, or 'All' to view all threads. Use the 'Assigned to' dropdown to filter by assignee.
5. **Filter by date:** By clicking on the highlighted 'Calendar' icon, you can filter comments and tasks based on a date range.
6. **Edit/delete comment:** To edit the comment, click the pencil icon, and to delete it, click the bin icon.
7. **Resolve/lock threads:** There are options for resolving or locking the thread, as shown below. A resolved thread signifies the completion of a task, while locked threads are closed to user edits and replies.
8. **Re-open resolved task:** You can re-open a resolved thread by replying to it or by clicking on the **Re-open thread** icon.
9. **Unlock thread:** To unlock a thread for editing or adding replies, click the icon shown below.
10. **Assign users:** You can also assign users from here.

In the next section, we will look at the various comment settings.


# Assign users & task status

In this section, we’ll explore how to assign tasks to stakeholders and track their progress using the comments thread. Monitoring task status with terms like ‘Resolved', ‘Open', etc. ensures clear communication and efficient collaboration, especially when managing inputs from multiple stakeholders. You can achieve this with EDITable, which can help your team with accountability and improve workflow efficiency.

## 1. Assign tasks <a href="#id-1.-assign-tasks" id="id-1.-assign-tasks"></a>

1. Let's add a column-level comment and assign it as a task. Select a column and click on **Add a comment.**
2. Enter a comment. Click on the 'Assign a user' dropdown.
3. From the dropdown, select the desired user.
4. After selecting the user, click **Post** to post the comment. The status is set to 'Open'.
5. The task gets assigned.

## 2. Task status <a href="#id-2.-task-status" id="id-2.-task-status"></a>

1. By default, on assigning a task, it is set to 'Open'. To change the task status, click on the 'three dots' and select **Resolve thread**.
2. The thread is marked as resolved, as shown below.
3. Resolved tasks can be reopened if required by clicking on the 'Undo' icon. Alternatively, replying to any resolved thread will automatically make it open again.
4. Comments added in the comments column can also be assigned as tasks. Select a comment and assign it to a user.
5. By clicking on the arrow highlighted, you can expand/collapse the task status and assignee columns. Based on the selection in the comments editor, these columns get populated automatically.
6. The status and assignee can be viewed in the columns as below. These columns are available when you enable the comments column and add comments to it.

In the next section, we'll cover how you can track task status and changes for all comments.


# Formatting & Display

This section describes the formatting and display options available in PowerTable. You can use the settings available here to customize the appearance of your table app.


# Basic formatting

The toolbar contains a host of formatting options, as shown below:

<figure><img src="https://1781349671-files.gitbook.io/~/files/v0/b/gitbook-x-prod.appspot.com/o/spaces%2FKyXRCFh0c08ryiUFvyMV%2Fuploads%2FQyyJcPOKZDOfCPv57Iu9%2Fimage.png?alt=media&amp;token=2cebbd4e-d3d1-4461-a02c-8cf2bc5f548b" alt=""><figcaption><p>Row height and header fit</p></figcaption></figure>

1. **Undo/Redo:** Use these options to quickly undo or redo recent changes to data or formatting, allowing for easy corrections.
2. **Row Height:** Set the desired row height for the table.
3. **Word Wrap:** This option wraps long text to multiple lines for improved readability.
4. **Auto Fit:** Adjust column widths with options such as "Fit to Header," "Fit to Content," or manually setting the column width to your preference.

By selecting a row or a column, you'll get cell and text formatting options such as, **Bold, Italic, underline, fill color, font color, and border style.** When you select a column, along with these options, you have options to align the column values to the left or to the right.

<figure><img src="https://1781349671-files.gitbook.io/~/files/v0/b/gitbook-x-prod.appspot.com/o/spaces%2FKyXRCFh0c08ryiUFvyMV%2Fuploads%2FQeAYFCN6VnSF2A2LMEds%2Fimage.png?alt=media&amp;token=38921d08-7ed7-4901-9aa5-8ca73c2aeac6" alt=""><figcaption><p>Formatting options</p></figcaption></figure>


# Display Settings

Customize the visual appearance properties of your table to match your desired style and format.

Click on the **Appearance** tab.

<figure><img src="https://1781349671-files.gitbook.io/~/files/v0/b/gitbook-x-prod.appspot.com/o/spaces%2FKyXRCFh0c08ryiUFvyMV%2Fuploads%2FCexxibOHQo2RMoOzVA9o%2Fimage.png?alt=media&amp;token=a1c23c83-eecc-46f4-a422-e4da1940db5c" alt=""><figcaption><p>Display settings</p></figcaption></figure>

## 1. Font

This option lets you choose your preferred font style for the table.&#x20;

## 2. Font Size

Using this option you can adjust the font size in the table.

## **3. Text Color**

You can change the color of the text/values in the visual using this option.

## **4. Header Orientation**

This option lets you set the orientation of the header text: horizontal, vertical, clockwise, and counterclockwise.

## **5. Header Text Color**

You can change the color of the header text in the visual using this option.

## 6. Display Type in Header

Toggling on this option displays the input type of the respective columns along with headers.

## 7. Row Highlight

This option allows you to highlight the rows in the report. The various row highlight types are:

* **Row Hover**
* **Row Alternate**
* **Row Alternate Contrast**
* **Row Alternate Flashy**
* **Off**

### **7.1. Row hover**

Highlights the row upon hovering over them. By default, all the tables are configured with the 'Row Hover' highlight option. The following options are displayed in this type:

**Hover Text** - This option allows you to set the text color of the row on hover.

**Background** - This option allows you to set the background color of the row on hover.

### **7.2. Row alternate**

This option highlights alternate rows. All of the row highlight options are customized with predefined colors. If you enable this option, the following options are displayed:

**Odd row** - This option allows you to set the color of the odd rows.

**Even row** - This option allows you to set the color of the even rows.

### **7.3. Row alternate contrast**

This option highlights the odd and even rows with contrasting color shades by default. If you enable this option, the **Odd row** and **Even row** options are displayed.

### **7.4. Row alternate flashy**

This option highlights the odd and even rows with flashy color shades. If you enable this option, the **Odd row** and **Even row** options are displayed.

You can remove the row highlight by selecting the **Off** option from the drop-down.

## 8. Table Padding

This option allows you to insert spacing/padding for the table from the top, bottom, left, and right. The minimum and maximum padding values are 0 and 100 respectively.

## 9. Gridlines

You can add **Horizontal**, **Header**, and **Vertical** properties for gridlines.

### **9.1. Horizontal**

This option lets you set the horizontal gridlines for the rows. You can select from the following options:

* **Solid lines**
* **Dashed lines**
* **Off**

If the 'Solid Lines' or 'Dashed Lines' option is selected for the horizontal gridlines, then a color picker is enabled. Using the color picker, you can customize the color of the single/double horizontal gridlines. You can also set the number of rows to skip between 2 consecutive lines.

### **9.2. Vertical**

This option lets you insert vertical lines between columns. You can select from the following options:

* **Solid -** This option will insert solid vertical lines to the right of each column.
* **Off** - This option will turn off the vertical lines

If the 'Solid lines' option is selected for the vertical lines, a color picker option is enabled. Using the color picker, you can customize the color of the solid vertical lines.

### **9.3. Header Border**

This option lets you insert gridlines for the column headers. If this option is enabled, then a color picker option becomes available next to it. Using the color picker option you can customize the color of the header gridline.

The color of the header gridline is the same as that of the horizontal gridlines by default.

If you change the color of the header gridline, the color of the horizontal gridlines also gets changed accordingly.

### **9.4. Skip lines**

This option allows you to set the gridline gap between the rows. The minimum and maximum skip line values are 1 and 10 respectively.

## 10. Show Outline <a href="#id-3.-outline" id="id-3.-outline"></a>

This option allows you to set the outline for the visual. If you enable this option, a color picker is enabled. The color picker allows you to select the color of the outline.&#x20;


# Formulas & Functions

PowerTable features an Excel-like formula engine that supports over 50 functions, including logical, Boolean, date, math, and others. The formula editor is intuitive and user-friendly and offers dynamic help suggestions regarding syntax and examples. It includes features like auto-complete and multi-line support to better assist users in creating and troubleshooting formulas.

Formulas are used while inserting a formula column or to set up data-derived default values.

A formula can contain functions, expressions, references, and constants.

1. A function takes in one or more values and performs a defined operation to return a result. Every function is defined with a keyword and a specific syntax that is to be followed.
2. Expressions are references with logical or mathematical operators that specify the operation to be performed.
3. References are the cell names containing values.
4. Constant refers to a value or a number that does not change.

## Formula Column

{% hint style="info" %}
Please refer to [this section](/explore-powertable/working-with-powertable/column-setup/add-formula-column) to understand the steps to insert a formula column.
{% endhint %}

While adding a formula column to your table, you can just start typing in the required formulas in the formula box. As you start typing, a help menu appears, allowing you to autocomplete your formulas.&#x20;

To get suggestions about formulas or insert them, click the **Functions** tab. The **Reference** tab allows you to add columns and refer to them in your formula.

<figure><img src="https://1781349671-files.gitbook.io/~/files/v0/b/gitbook-x-prod.appspot.com/o/spaces%2FKyXRCFh0c08ryiUFvyMV%2Fuploads%2FeH3DDTuvARUhN0OutOze%2Fimage.png?alt=media&amp;token=0a25c2e0-e39c-490e-8b50-93ff2149502b" alt=""><figcaption><p>Adding formula in the formula column</p></figcaption></figure>

## Default Value

Default values automatically populate columns with predefined data when none is provided, helping maintain data consistency, prevent nulls, and simplify data entry. You can manually enter static data or set up a formula for a dynamic default value, whose value is derived and thus dependent on existing data.&#x20;

<figure><img src="https://1781349671-files.gitbook.io/~/files/v0/b/gitbook-x-prod.appspot.com/o/spaces%2FKyXRCFh0c08ryiUFvyMV%2Fuploads%2FNGSzS82DoQGedIY4mrFd%2Fimage.png?alt=media&amp;token=e4474111-dbe4-43e7-a35a-c93322d977fc" alt=""><figcaption><p>Adding formula for default value</p></figcaption></figure>

PowerTable formulas can be classified into:

* [Conditional Statements](/explore-powertable/formulas-and-functions/conditional-statements)
* [Logical Functions](/explore-powertable/formulas-and-functions/logical-functions)
* [Math Functions](/explore-powertable/formulas-and-functions/math-functions)
* [Text Formatting Functions](/explore-powertable/formulas-and-functions/text-formatting-functions)
* Date functions
* Other Operators


# Conditional Statements

<table><thead><tr><th width="168">NAME</th><th>DESCRIPTION</th><th data-hidden></th></tr></thead><tbody><tr><td><a href="/explore-powertable/formulas-and-functions/conditional-statements/if">IF</a></td><td>Checks a condition and returns one value when it is TRUE; otherwise, it returns a second value.</td><td></td></tr><tr><td><a href="/explore-powertable/formulas-and-functions/conditional-statements/ifna">IFNA</a></td><td>Evaluates an expression and returns a specified value if the expression returns an #N/A error; otherwise, it returns the value of the expression itself.</td><td></td></tr><tr><td><a href="/explore-powertable/formulas-and-functions/conditional-statements/switch">SWITCH</a></td><td>Evaluates an expression against a list of values and returns one of multiple possible result expressions. The first matching value is returned. If there is no match, an optional default value is returned. This function can be used to avoid having multiple nested <a href="/explore-powertable/formulas-and-functions/conditional-statements/if">IF </a>statements. </td><td></td></tr><tr><td><a href="/explore-powertable/formulas-and-functions/conditional-statements/filterif">FILTERIF</a></td><td>Returns the list of items that match the given condition.</td><td></td></tr></tbody></table>


# IF

The IF function checks a condition and returns one value when it is TRUE; otherwise, it returns a second value.

### Syntax

```dax
IF(logical_test,value_if_true,value_if_false)
```

### Arguments

logical\_test – Any value or expression that can be evaluated as TRUE or FALSE.

value\_if\_true – The value to be returned if the logical test is TRUE.

value\_if\_false – The value to be returned if the logical test is FALSE.

### Return value

The return value can be either *value\_if\_true* or *value\_if\_false*.

### Example 1

```javascript
IF(PY > 0,(AC-PY)/PY,0)
```

The above formula returns (AC-PY)/PY if the PY value is greater than 0; otherwise, it returns 0.

### Excel equivalent

[IF](https://support.microsoft.com/en-us/office/if-function-69aed7c9-4e8a-4755-a9bc-aa8bbff73be2)


# IFNA

The IFNA function evaluates an expression and returns a specified value if the expression returns an #N/A error; otherwise, it returns the value of the expression itself.

### Syntax

```javascript
IFNA(value,value_if_error)
```

### Arguments

value- The argument that is checked for the #N/A error value.

value2- The value to return if the formula evaluates to the #N/A error value.

### **Return value**

Either *value1* or *value2.*

### **Example**

```javascript
IFNA((AC-PY)/PY,0)
```

If the value is a number, the function returns (AC-PY)/PY; otherwise, it returns 0.

### **Excel equivalent**

[IFNA](https://support.microsoft.com/en-us/office/ifna-function-6626c961-a569-42fc-a49d-79b4951fd461)


# SWITCH

Evaluates an expression against a list of values and returns one of multiple possible result expressions. The first matching value is returned. If there is no match, an optional default value is returned. This function can be used to avoid having multiple nested [IF ](/explore-powertable/formulas-and-functions/conditional-statements/if)statements.&#x20;

### Syntax

```javascript
SWITCH(expression,val1,res1,val2,res2,...,val_n,res_n,default)
```

### Arguments

expression – The expression or statement to be evaluated.

val1, val2, …, val\_n – The list of values to be compared against the expression.

res1, res2, …, res\_n – The result to be returned in case of a match.

default (Optional) – The default value to be returned if the expression does not match with any of the values in the argument list. This is an optional argument.

### **Return value**

The relevant result is returned when the expression matches the value; otherwise, a default result is provided if there is no match.

### **Example**

```javascript
SWITCH([AGE],30,"Young",55,"Old","Other")
```

Will return "Young" if the age is 30, "Old" if the age is 55, and "Other" for all other ages.

### **Excel equivalent**

[SWITCH](https://support.microsoft.com/en-us/office/switch-function-47ab33c0-28ce-4530-8a45-d532ec4aa25e)


# FILTERIF

The FILTERIF function can be used to filter an array of values based on a given condition. It returns an array—hence, it has to be used in conjunction with an aggregate function like SUM or AVERAGE. It can be used to populate a calculated row.

### Syntax

```javascript
FILTERIF(list,condition)
```

### Arguments

list – The input list of values on which the filter is to be applied.

condition – The condition to be evaluated.

### Return value

The function returns an array.

### Example 1

```javascript
FILTERIF([AGE],">50")
```

The formula above will use FILTERIF to filter all the rows of people whose age exceeds 50.

### Example 2

```javascript
AVERAGE(FILTERIF([Column1,Column2,Column3],">1000"))
```

The above example calculates the average of values in Columns 1, 2, and 3 that are greater than 1,000.


# Logical functions

<table><thead><tr><th width="138">NAME</th><th width="543">DESCRIPTION</th><th data-hidden>SYNTAX</th><th data-hidden>EXPLANATION</th><th data-hidden>EXAMPLE</th></tr></thead><tbody><tr><td>AND</td><td>Returns TRUE only if all the conditions are TRUE; otherwise, returns FALSE.</td><td></td><td></td><td></td></tr><tr><td>IN</td><td>Returns TRUE if the list of values being searched is in the array</td><td></td><td></td><td></td></tr><tr><td>ISBLANK</td><td>Returns the logical value TRUE if the value argument is a reference to an empty cell.</td><td>ISBLANK(value)</td><td>Returns TRUE if AC is empty</td><td>ISBLANK(AC)</td></tr><tr><td>ISEMPTY</td><td>Returns the logical value TRUE if the value argument is a reference to an empty cell.</td><td>ISEMPTY(value)</td><td>Returns TRUE if AC has no value</td><td>ISEMPTY(AC)</td></tr><tr><td>ISNUMBER</td><td>Returns the logical value TRUE if the value argument is a valid number</td><td>ISNUMBER(value)</td><td>Returns AC-PY/PY if the value is a number else returns 0</td><td>IF(ISNUMBER((AC-PY)/PY), (AC-PY)/PY , 0)</td></tr><tr><td>NOT</td><td>Changes FALSE to TRUE and TRUE to FALSE.</td><td>NOT( logical_test )</td><td>Will return 50 if the region is not West otherwise returns 25</td><td>IF(NOT(Region == "West"), 50, 25)</td></tr><tr><td>OR</td><td>Returns TRUE if any of the conditions are TRUE and FALSE only if all arguments are FALSE.</td><td>OR( logical_test1, [logical_test2], ... )</td><td>Will return 25 if the region is West or East otherwise returns 30</td><td>IF(OR(Region == "West", Region =="East"), 25, 30)</td></tr><tr><td>XOR</td><td>Returns a logical 'Exclusive OR' of all the arguments</td><td>XOR( logical_test1, [logical_test2], ... )</td><td>Will return 25 for all category in the West except for category Urban, and returns 25 for all Urban category under all region except for west, for all other items returns 30</td><td>IF(XOR(Region == "West", Category=="Urban"), 25, 30)</td></tr></tbody></table>

### Logical Operators

<table><thead><tr><th width="174.33333333333334">TITLE</th><th>OPERATORS</th><th>DESCRIPTION</th></tr></thead><tbody><tr><td>AND</td><td>&#x26;&#x26;</td><td>Logical AND</td></tr><tr><td>OR</td><td>||</td><td>Logical OR</td></tr></tbody></table>


# AND

The AND function returns TRUE if all the conditions are TRUE and returns FALSE if any of the conditions are FALSE.

### Syntax

```javascript
AND(logical_test1,logical_test2, ... )
```

### Arguments

logical\_test1 – The first condition to be evaluated. This is a required argument.

logical\_test2,.. – The additional conditions to be evaluated. These are optional arguments.

### **Return value**

Either True or False

### **Example**

```javascript
if(and(Region == "West", Category=="Urban"), 25, 30)
```

Returns 25 if the region is West and the category is Urban, otherwise returns 30

### **Excel equivalent**

[AND](https://support.microsoft.com/en-us/office/and-function-5f19b2e8-e1df-4408-897a-ce285a19e9d9)


# Math functions

<table><thead><tr><th width="216">NAME</th><th width="522">DESCRIPTION</th><th data-hidden>SYNTAX</th><th data-hidden>EXAMPLE</th><th data-hidden>EXPLANATION</th></tr></thead><tbody><tr><td>ABS</td><td>Returns the absolute value of a number, a number without its sign</td><td>ABS(value)</td><td>ABS(COLUMN1)</td><td>Returns the absolute value of COLUMN1</td></tr><tr><td>AVERAGE</td><td>Returns the average of the arguments</td><td>Average(value1,[value2]....)</td><td>AVERAGE(COLUMN1, COLUMN2)</td><td>Returns the average of COLUMN1, COLUMN1</td></tr><tr><td>AVERAGEIF</td><td>Returns the average of the filtered values that satisfy the given condition</td><td>AVERAGEIF([Range], condition)</td><td>AVERAGEIF([Quantity],[Units Sold], “>10000”)</td><td>Returns the average of Quantity and Units Sold if they are above 10000</td></tr><tr><td>AVERAGEEXNEG</td><td>Returns the average of the arguments excluding negatives</td><td>AverageExNeg(value1,[value2]....)</td><td></td><td></td></tr><tr><td>AVERAGEEXZERO</td><td>Returns the average of the arguments excluding zeros</td><td>AverageExZero(value1,[value2]....)</td><td></td><td></td></tr><tr><td>AVERAGEEXZERONEG</td><td>Returns the average of the arguments excluding zeros and negatives</td><td>AverageExZeroNeg(value1,[value2]....)</td><td></td><td></td></tr><tr><td>CEILING</td><td>Rounds a number to the nearest integer or to the nearest multiple of significance</td><td>CEILING(value, significance)</td><td>CEILING(COLUMN1)</td><td>Returns the ceiling of COLUMN1 to the significance of two decimal</td></tr><tr><td>COUNT</td><td>Counts the number of items in the list</td><td>COUNT (value1,value2....)</td><td>COUNT(Column1,Column2,Column3)</td><td>Returns the count of the number of items in a range</td></tr><tr><td>COUNTIF</td><td>Returns the count of items that match the specified condition</td><td>Count(list, condition)</td><td>COUNTIF([100,500,120],"&#x3C;200") COUNTIF([[Quantity],[Units Sold]],BLANK)</td><td>Returns 2, since only two value in the given list matches the condition Returns 1,2 or 0 depending on how many blank values are in Quantity, Units Sold in each row. This value can be used to set conditional formatting or used with IF condition to fill value in another column</td></tr><tr><td>DIVIDE</td><td>Returns the division of two values</td><td>DIVIDE(Numerator, Denominator, Alternate)</td><td>DIVIDE(COLUMN1, COLUMN2, 0)</td><td>Returns COLUMN1/COLUMN2 and if any error, returns 0</td></tr><tr><td>EVEN</td><td>Rounds to the nearest higher even number</td><td></td><td></td><td></td></tr><tr><td>EXP</td><td>Returns e raised to the power of a given number</td><td>EXP(value)</td><td>EXP(COLUMN1)</td><td>Returns the exponential of COLUMN1</td></tr><tr><td>FLOOR</td><td>Rounds a number (towards zero) to the nearest specified multiple of significance</td><td>FLOOR(value, significance)</td><td>FLOOR(COLUMN1)</td><td>Returns the floor of COLUMN1 to the significance of two decimal</td></tr><tr><td>INDEXOF</td><td>Returns the index of the first occurrence of a number in an array of numbers</td><td></td><td></td><td></td></tr><tr><td>LOG</td><td>Returns the logarithm of a number to the base specified</td><td>LOG(value,base)</td><td>LOG(COLUMN1, 10)</td><td>Returns the Log to the base 10 of COLUMN1</td></tr><tr><td>MAX</td><td>Returns the largest number in a set of values</td><td>Max(value1,[value2]....)</td><td>MAX(COLUMN1,COLUMN2,COLUMN3)</td><td>Returns the maximum of COLUMN1, COLUMN2, COLUMN3</td></tr><tr><td>MIN</td><td>Returns the smallest number in a set of values</td><td>Min(value1,[value2]....)</td><td>MIN(COLUMN1,COLUMN2,COLUMN3)</td><td>Returns the minimum of COLUMN1, COLUMN2, COLUMN3</td></tr><tr><td>MROUND</td><td>The MROUND function rounds a number to the nearest multiple of a specified value.</td><td></td><td></td><td></td></tr><tr><td>ODD</td><td>Rounds to the nearest higher odd number</td><td></td><td></td><td></td></tr><tr><td>POWER</td><td>Returns the result of a number raised to a power</td><td>POW(value,power)</td><td>POW(COLUMN1, 2)</td><td>Returns the COLUMN1 to the power of 2</td></tr><tr><td>RAND</td><td>Returns a random number between 0 and 1</td><td>RAND()</td><td>RAND(0,1)</td><td>Returns a random number like 0.1,0.2,..</td></tr><tr><td>RANDBETWEEN</td><td>Returns a random number between two values</td><td>RANDBETWEEN(value1,value2)</td><td>RANDBETWEEN(0,100)</td><td>Returns a random number between 0 and 100</td></tr><tr><td>ROUND</td><td>Rounds a number to the specified number of decimal places</td><td>ROUND(value, significance)</td><td>ROUND(COLUMN1, 2)</td><td>Returns the round of COLUMN1 to the significance of two decimal</td></tr><tr><td>ROUNDDOWN</td><td>The ROUNDDOWN function always rounds a number down, toward zero</td><td></td><td></td><td></td></tr><tr><td>ROUNDUP</td><td>The <strong>ROUNDUP</strong> function always rounds a number up, away from zero</td><td></td><td></td><td></td></tr><tr><td>SQRT</td><td>Returns the square root of a number</td><td>SQRT(value)</td><td>SQRT(COLUMN1)</td><td>Returns the exponential of COLUMN1</td></tr><tr><td>SUM</td><td>Returns the sum of all the numbers in the argument</td><td>Sum(value1,[value2]....)</td><td>SUM(COLUMN1, COLUMN2)</td><td>Returns the sum of COLUMN1 and COLUMN2</td></tr><tr><td>PCT</td><td>Used for a percentage calculation</td><td>PCT(value:number)</td><td>SALES + PCT(10) = SALES + 10%</td><td>Returns percentage value</td></tr></tbody></table>

### Finance Function

<table><thead><tr><th width="273"></th><th></th></tr></thead><tbody><tr><td>PMT</td><td>Calculates the payment for a loan based on constant payments and a constant interest rate</td></tr></tbody></table>


# Text formatting functions

<table><thead><tr><th width="207">NAME</th><th width="510">DESCRIPTION</th><th data-hidden>SYNTAX</th><th data-hidden>EXAMPLE</th><th data-hidden>EXPLANATION</th></tr></thead><tbody><tr><td>CONCATENATE</td><td>Concatenates two or more text strings into one string</td><td>CONCATENATE(string1, string2, ..)</td><td>CONCATENATE("Today's price is ",TEXT(6000,"$###,###.00"))</td><td>Will return "Today's price is $6,000</td></tr><tr><td>HYPERLINK</td><td>Returns hyperlinked text which will navigate to a given URL</td><td></td><td></td><td></td></tr><tr><td>LEFT</td><td>Extracts text from the left of the value up to the number of characters specified</td><td>LEFT(text/number, [num_chars])</td><td>LEFT([Full Name],4)</td><td>When field Full Name has values such as Johny Rivers, this will return John</td></tr><tr><td>LOWER</td><td>Converts a text string into lowercase</td><td></td><td></td><td></td></tr><tr><td>MID</td><td>Extracts text from the mid of a string from the position provided up to the number of characters specified in length</td><td>Mid (text, position, length)</td><td>MID([Full Name],0,7)</td><td>When field Full Name has values such as Johny Rivers, this will return Johny R</td></tr><tr><td>PROPER</td><td>Converts the first character of a text string into uppercase</td><td></td><td></td><td></td></tr><tr><td>REPLACE</td><td>Replaces an input text string with a given value</td><td></td><td></td><td></td></tr><tr><td>REPT</td><td>Repeats a given text string a specified number of times</td><td></td><td></td><td></td></tr><tr><td>RIGHT</td><td>Extracts text from the right of the value up to the number of characters specified</td><td>RIGHT(text/number, [num_chars])</td><td>RIGHT([Full Name],6)</td><td>When field Full Name has values such as Johny Rivers, this will return Rivers</td></tr><tr><td>TEXT</td><td>Formats the value to the given format string</td><td>TEXT(value, format)</td><td>TEXT(6000,"$###,###.00")</td><td>Will return $6,000</td></tr><tr><td>TRIM</td><td>Removes leading and trailing spaces</td><td></td><td></td><td></td></tr><tr><td>UPPER</td><td>Converts a text string into uppercase</td><td></td><td></td><td></td></tr><tr><td>VALUE</td><td>Converts a text string that represents a number to a number</td><td>VALUE(value:string)</td><td>VALUE(MID”ABC-123-WEW”,5,3))</td><td>Returns “123” as number</td></tr></tbody></table>


# Date functions

<table><thead><tr><th width="264">NAME</th><th>DESCRIPTION</th></tr></thead><tbody><tr><td>DATEADD</td><td>Adds a specified number of days to the input date</td></tr><tr><td>DATEDIFF</td><td>Returns the number of days between two input dates</td></tr><tr><td>DAY</td><td>Extracts the day of the month from an input date</td></tr><tr><td>DATE.SET</td><td>Returns a date after changing the format</td></tr><tr><td>EOMONTH</td><td>Returns a date specifying the last day of the month</td></tr><tr><td>FROMEXCELDATE</td><td>Converts an input date to a excel format date serial number</td></tr><tr><td>MONTH</td><td>Extracts the month from an input date</td></tr><tr><td>NOW</td><td>Returns the current date and timestamp</td></tr><tr><td>PERIOD_RANGE</td><td>Returns an array of date ranges between two specified dates</td></tr><tr><td>SHOWDATETIME</td><td>Returns the date and time period based on a given set of arguments</td></tr><tr><td>TIMEZONE</td><td>Enables you to refer to a specific UTC time zone.</td></tr><tr><td>TODAY</td><td>Returns the current date</td></tr><tr><td>TOEXCELDATE</td><td>Converts an excel recognized serial number to the equivalent date</td></tr><tr><td>YEAR</td><td>Extracts the year from an input date</td></tr></tbody></table>


# Other operators

| OPERATORS | DESCRIPTION                             |
| --------- | --------------------------------------- |
| +,-       | Addition & Subtraction                  |
| >, >=     | Greater than & Greater than or equal to |
| =, !=     | Equal to & Not equal to                 |
| \*, /     | Multiplication & Division               |
| ()        | Parenthesis                             |
| +, -      | Plus & Minus(-1)                        |
| <, <=     | Less than & Less than or equal to       |

The mentioned arithmetic and logical operators can be used with cell references and column measures as operands. These operators can also be used with cells/columns containing calendar dates.


# PowerTable Console

The PowerTable console, along with the [admin portal](/explore-powertable/admin-portal), provides an intuitive, sleek, and user-friendly interface for creating and managing tables, viewing and exporting transaction logs, monitoring the metrics, managing users, and more.

You can access it by clicking on **Lumel Admin Console.**&#x20;

<figure><img src="https://1781349671-files.gitbook.io/~/files/v0/b/gitbook-x-prod.appspot.com/o/spaces%2FKyXRCFh0c08ryiUFvyMV%2Fuploads%2FqTSLzOfw4DSodO9Ktu8K%2Fimage.png?alt=media&amp;token=7bcc1e3b-ffcb-49b5-af69-c76c99916011" alt=""><figcaption><p>Lumel Admin Console</p></figcaption></figure>

Sign in with your Microsoft Office 365 account.

<figure><img src="https://1781349671-files.gitbook.io/~/files/v0/b/gitbook-x-prod.appspot.com/o/spaces%2FKyXRCFh0c08ryiUFvyMV%2Fuploads%2FoFcm7jyI0tWpD9YXXSCp%2Fimage.png?alt=media&amp;token=dc34bb92-8d46-4884-81b6-67455c526f52" alt=""><figcaption><p>Sign in with Microsoft O365</p></figcaption></figure>

1. The **PowerTable console** allows you to view and manage source tables, transaction logs, and metrics, as well as manage your profile and onboarding actions.

<figure><img src="https://1781349671-files.gitbook.io/~/files/v0/b/gitbook-x-prod.appspot.com/o/spaces%2FKyXRCFh0c08ryiUFvyMV%2Fuploads%2FJTy0SZxjuf6ORSKnMAql%2Fimage.png?alt=media&amp;token=60fec15d-a57c-4237-8430-71e25073f54c" alt=""><figcaption><p>PowerTable console</p></figcaption></figure>

2. The **Admin Portal** provides exclusive configuration options for workspace admins, such as user management and other important settings, including general settings and writeback settings.

<figure><img src="https://1781349671-files.gitbook.io/~/files/v0/b/gitbook-x-prod.appspot.com/o/spaces%2FKyXRCFh0c08ryiUFvyMV%2Fuploads%2F6l3TWzHaHgOIq3BxLalN%2Fimage.png?alt=media&amp;token=afab616d-97f2-4c97-8ac6-e48099218179" alt=""><figcaption><p>Admin Portal</p></figcaption></figure>

The PowerTable console has the following menus and functions:

**Tables** - The 'Tables' menu displays a list of all tables configured in the PowerTable visual. Selecting any table on the left pane displays its configuration and connection details, as well as the transaction logs and reports on the right.

**Transaction Logs** - This option displays all types of transactions made on all the configured source tables by all users.&#x20;

**Insights/Metrics** - This option lets you view the ongoing, completed, queued, and failed jobs. You can also monitor the general health of the queueing system, email services, external applications' availability, and cloud storage connectivity.

**Manage Profile** - The 'My Profile' section in the PowerTable console allows you to view and manage your profile, integrations, writeback connections, and license details.

**Onboarding Actions** - This option opens a pop-up window that contains a list of onboarding actions like user management, application permissions, consents, and configurations of database connections for writeback/sync.&#x20;

**User Management** - This option available within the admin portal allows you to manage users and assign their roles.

**Settings** - This option lets the admin configure the general and writeback-related settings.


# Tables

This section displays a list of tables configured in the PowerTable visual on the left pane and their corresponding configuration details on the right side when clicked on each one of them.

<figure><img src="https://1781349671-files.gitbook.io/~/files/v0/b/gitbook-x-prod.appspot.com/o/spaces%2FKyXRCFh0c08ryiUFvyMV%2Fuploads%2FJTy0SZxjuf6ORSKnMAql%2Fimage.png?alt=media&amp;token=60fec15d-a57c-4237-8430-71e25073f54c" alt=""><figcaption><p>'Tables' section</p></figcaption></figure>

Use the search box to quickly search for the required table.

Upon selecting a specific table, the user can view three main items corresponding to that table: general details, approvals, and transaction logs.

### General <a href="#id-1.-general" id="id-1.-general"></a>

This page shows the column and connection details of the table.

* **Columns**: This section contains information about the columns in the table, such as column names, their data type, default values if they are configured, null/not-null property, any set constraints, relation, etc.
* **Connection Details:** The following connection details can be seen from this section:
  * **Connection Type**: The type of connection (e.g., Fabric Warehouse, Azure SQL, Snowflake, BigQuery, etc.).
  * **Account**: Account information associated with the table.
  * **Username**: The user who created or manages the table.
  * **Created At**: Timestamp of when the table was created.
  * **Updated At**: Timestamp of the most recent update to the table.
  * **Updated By**: The user who last updated the table.
* **Reports**: This part lists all published reports that use this connection and table, with their URL.

### Approvals <a href="#id-2.-approvals" id="id-2.-approvals"></a>

This page lists all approvals related to transactions involving the particular table. Here, you can track each approval's status and complete details of the request, such as the ID, requested user, approvers, created time, and reviewed time.

**Search:** You can search for specific approval requests using the search option.

**Filter:** You also have the option to filter approvals based on the requested user, status, approver, requested time, and reviewed time.

### Transaction logs <a href="#id-3.-transaction-logs" id="id-3.-transaction-logs"></a>

This tab logs all transactions made to the selected table and provides a historical record of changes for auditing and tracking purposes. You can view the complete details of every transaction, including the job ID, transaction type, number of rows affected, duration, status, the user’s name, and the time it was completed.

1. Search for a transaction using the search option.
2. Filter transactions using the ID, transaction type, user's name, status, start time, and the job type.
3. Click on any transaction ID to view detailed information about the transaction.


---

[Next Page](/llms-full.txt/1)